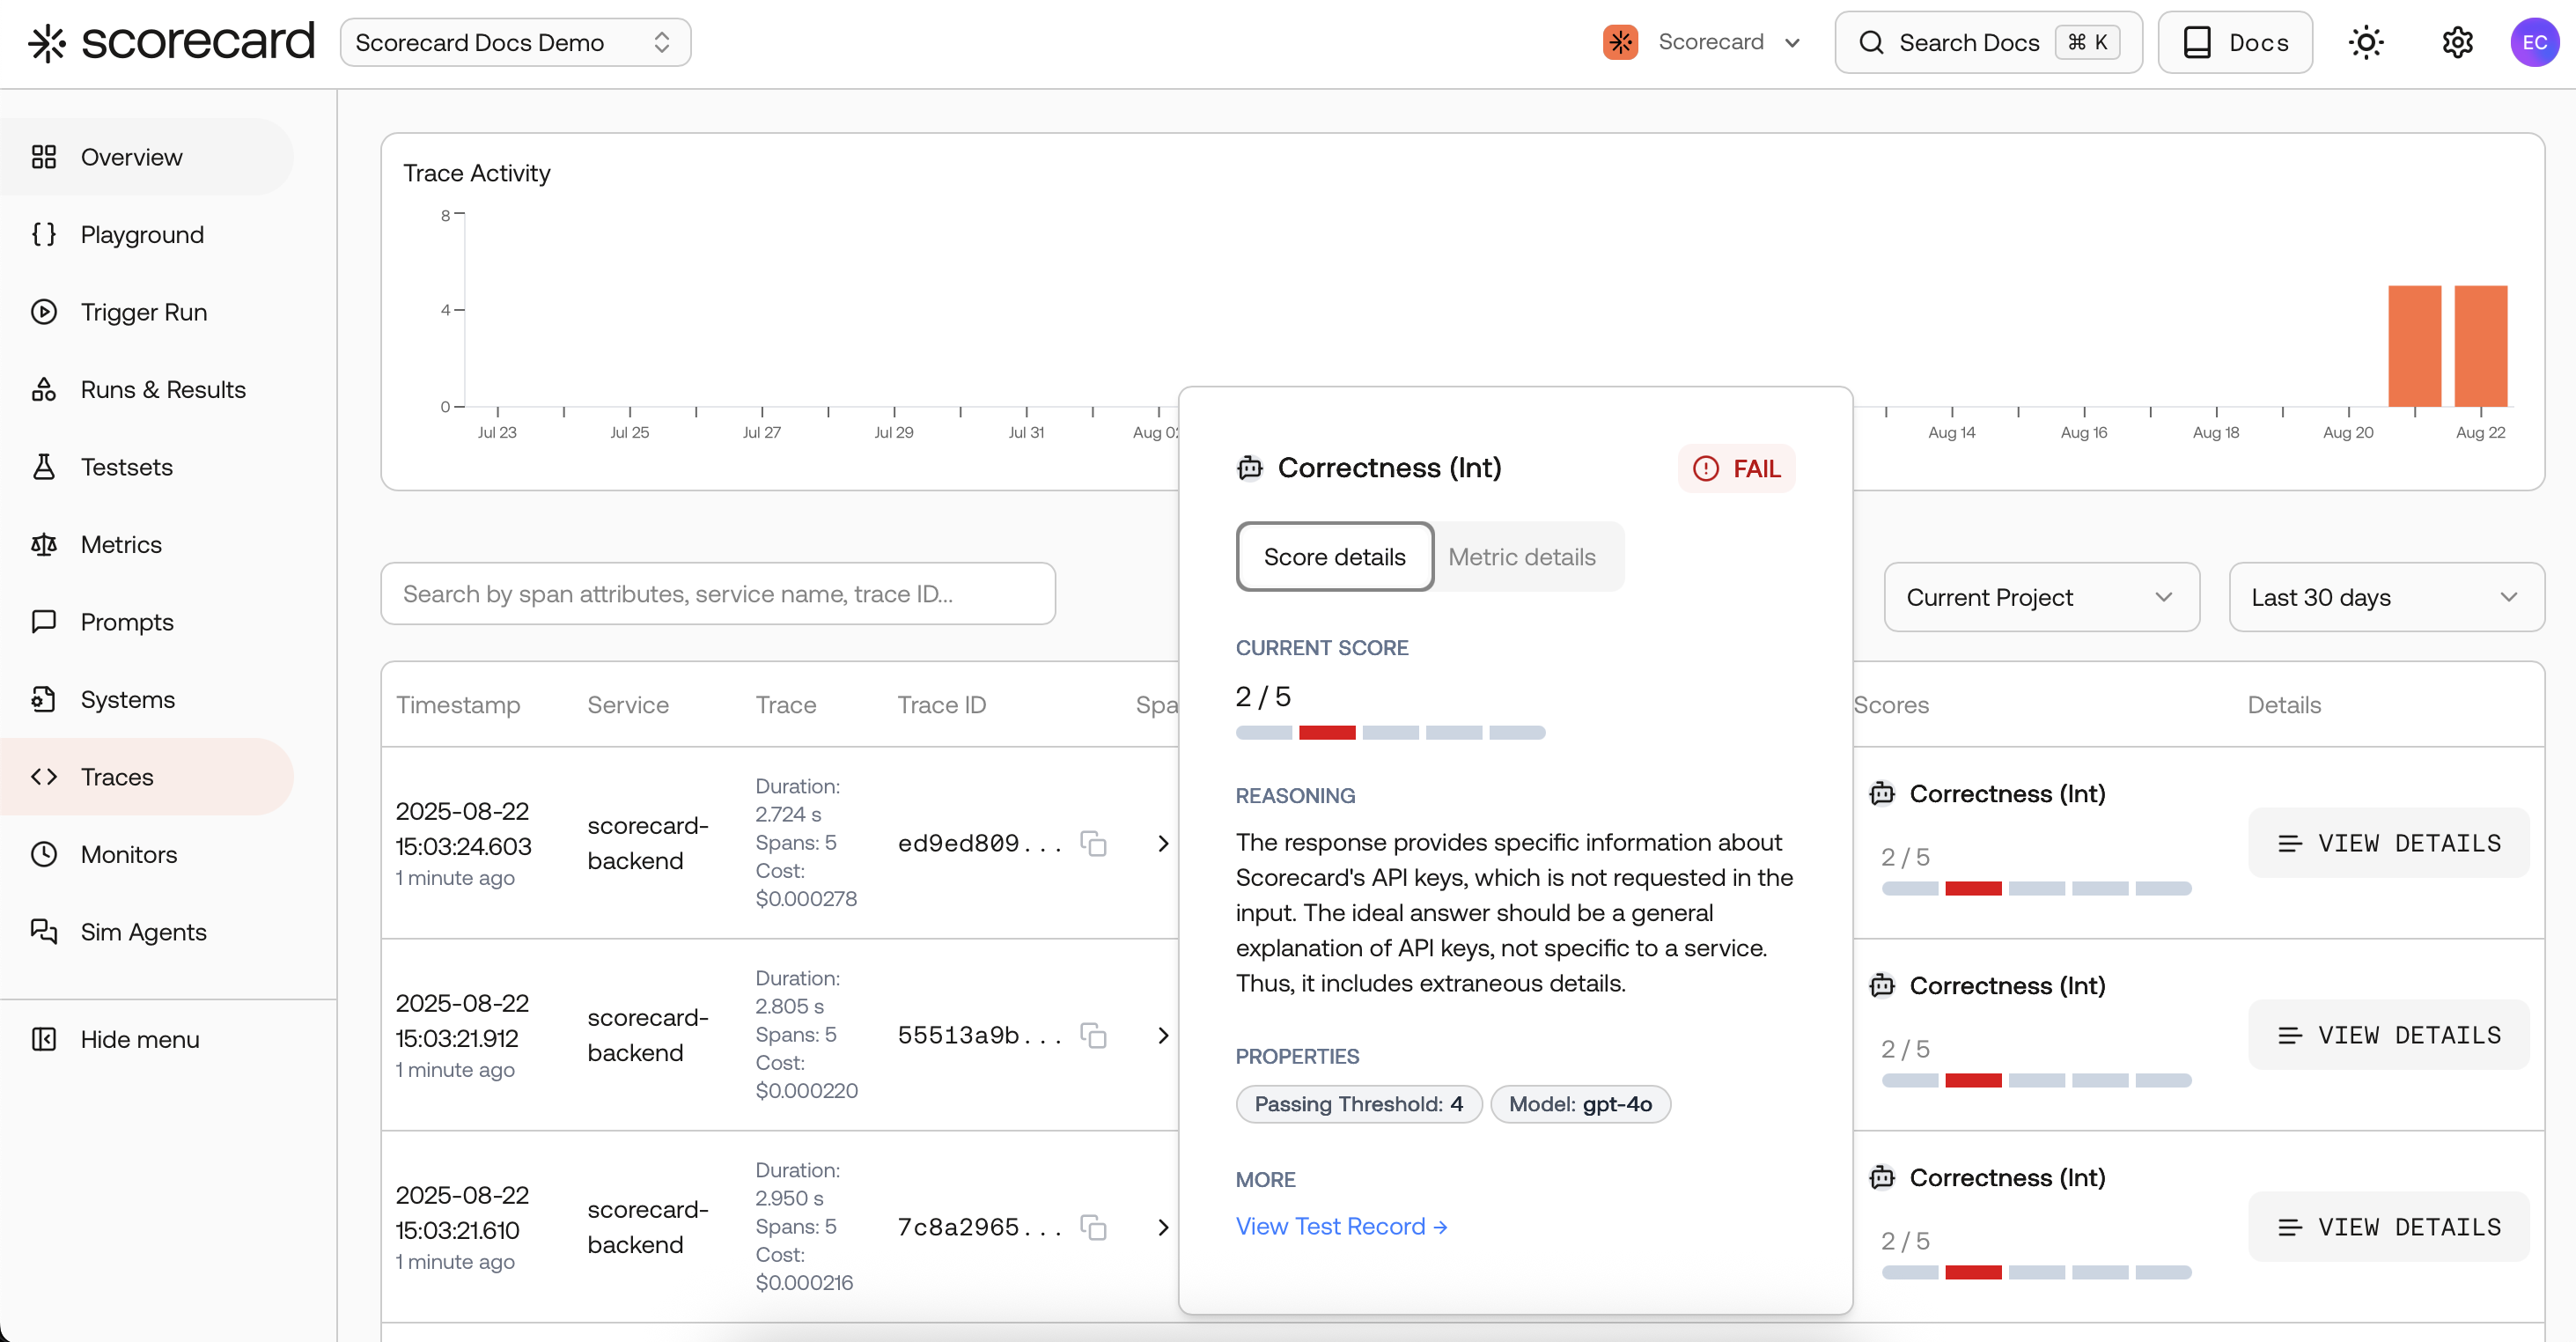
Traces search page with scores created by a 'monitor'.
Monitors work like observability dashboards, but with one key difference: Scorecard also runs evaluations/auto‑scoring on sampled traces so you see quality metrics over time, not just system metrics.
Steps
1
Instrument tracing (one-time)
Production monitoring relies on traces. Follow the Tracing Quickstart to connect your service and start sending spans. Once traces flow to your project, come back here to turn on continuous evaluation.
2
Configure a Monitor
In the Scorecard UI open Monitors → New Monitor.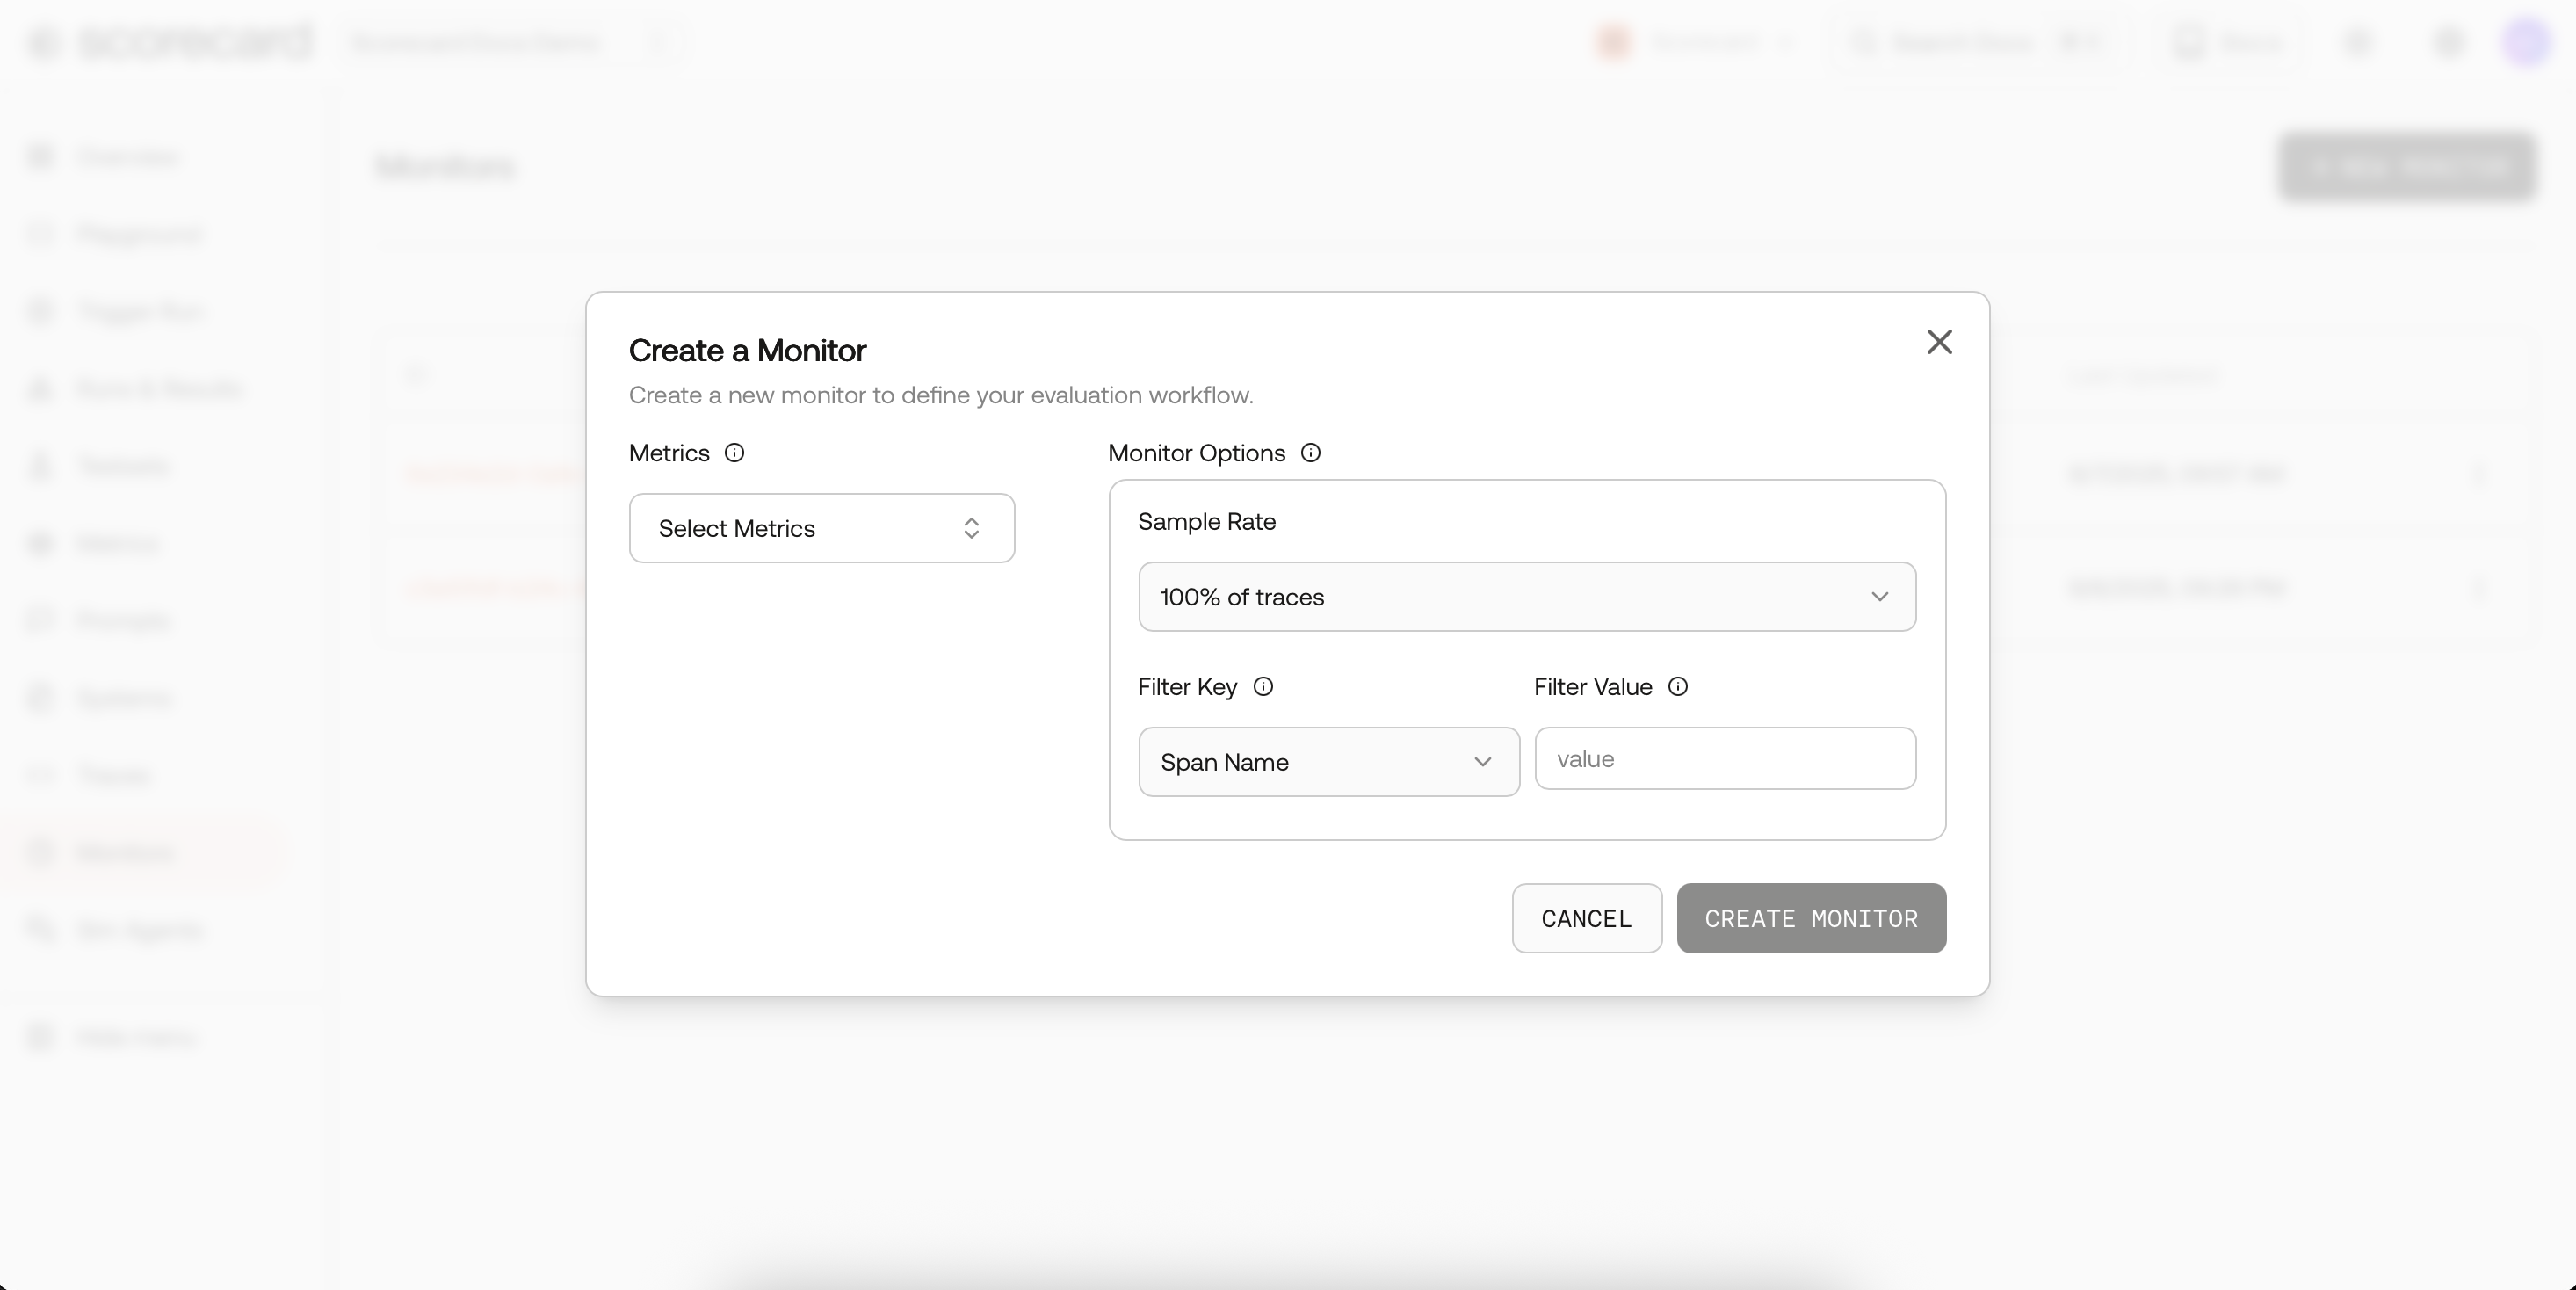 How sampling works
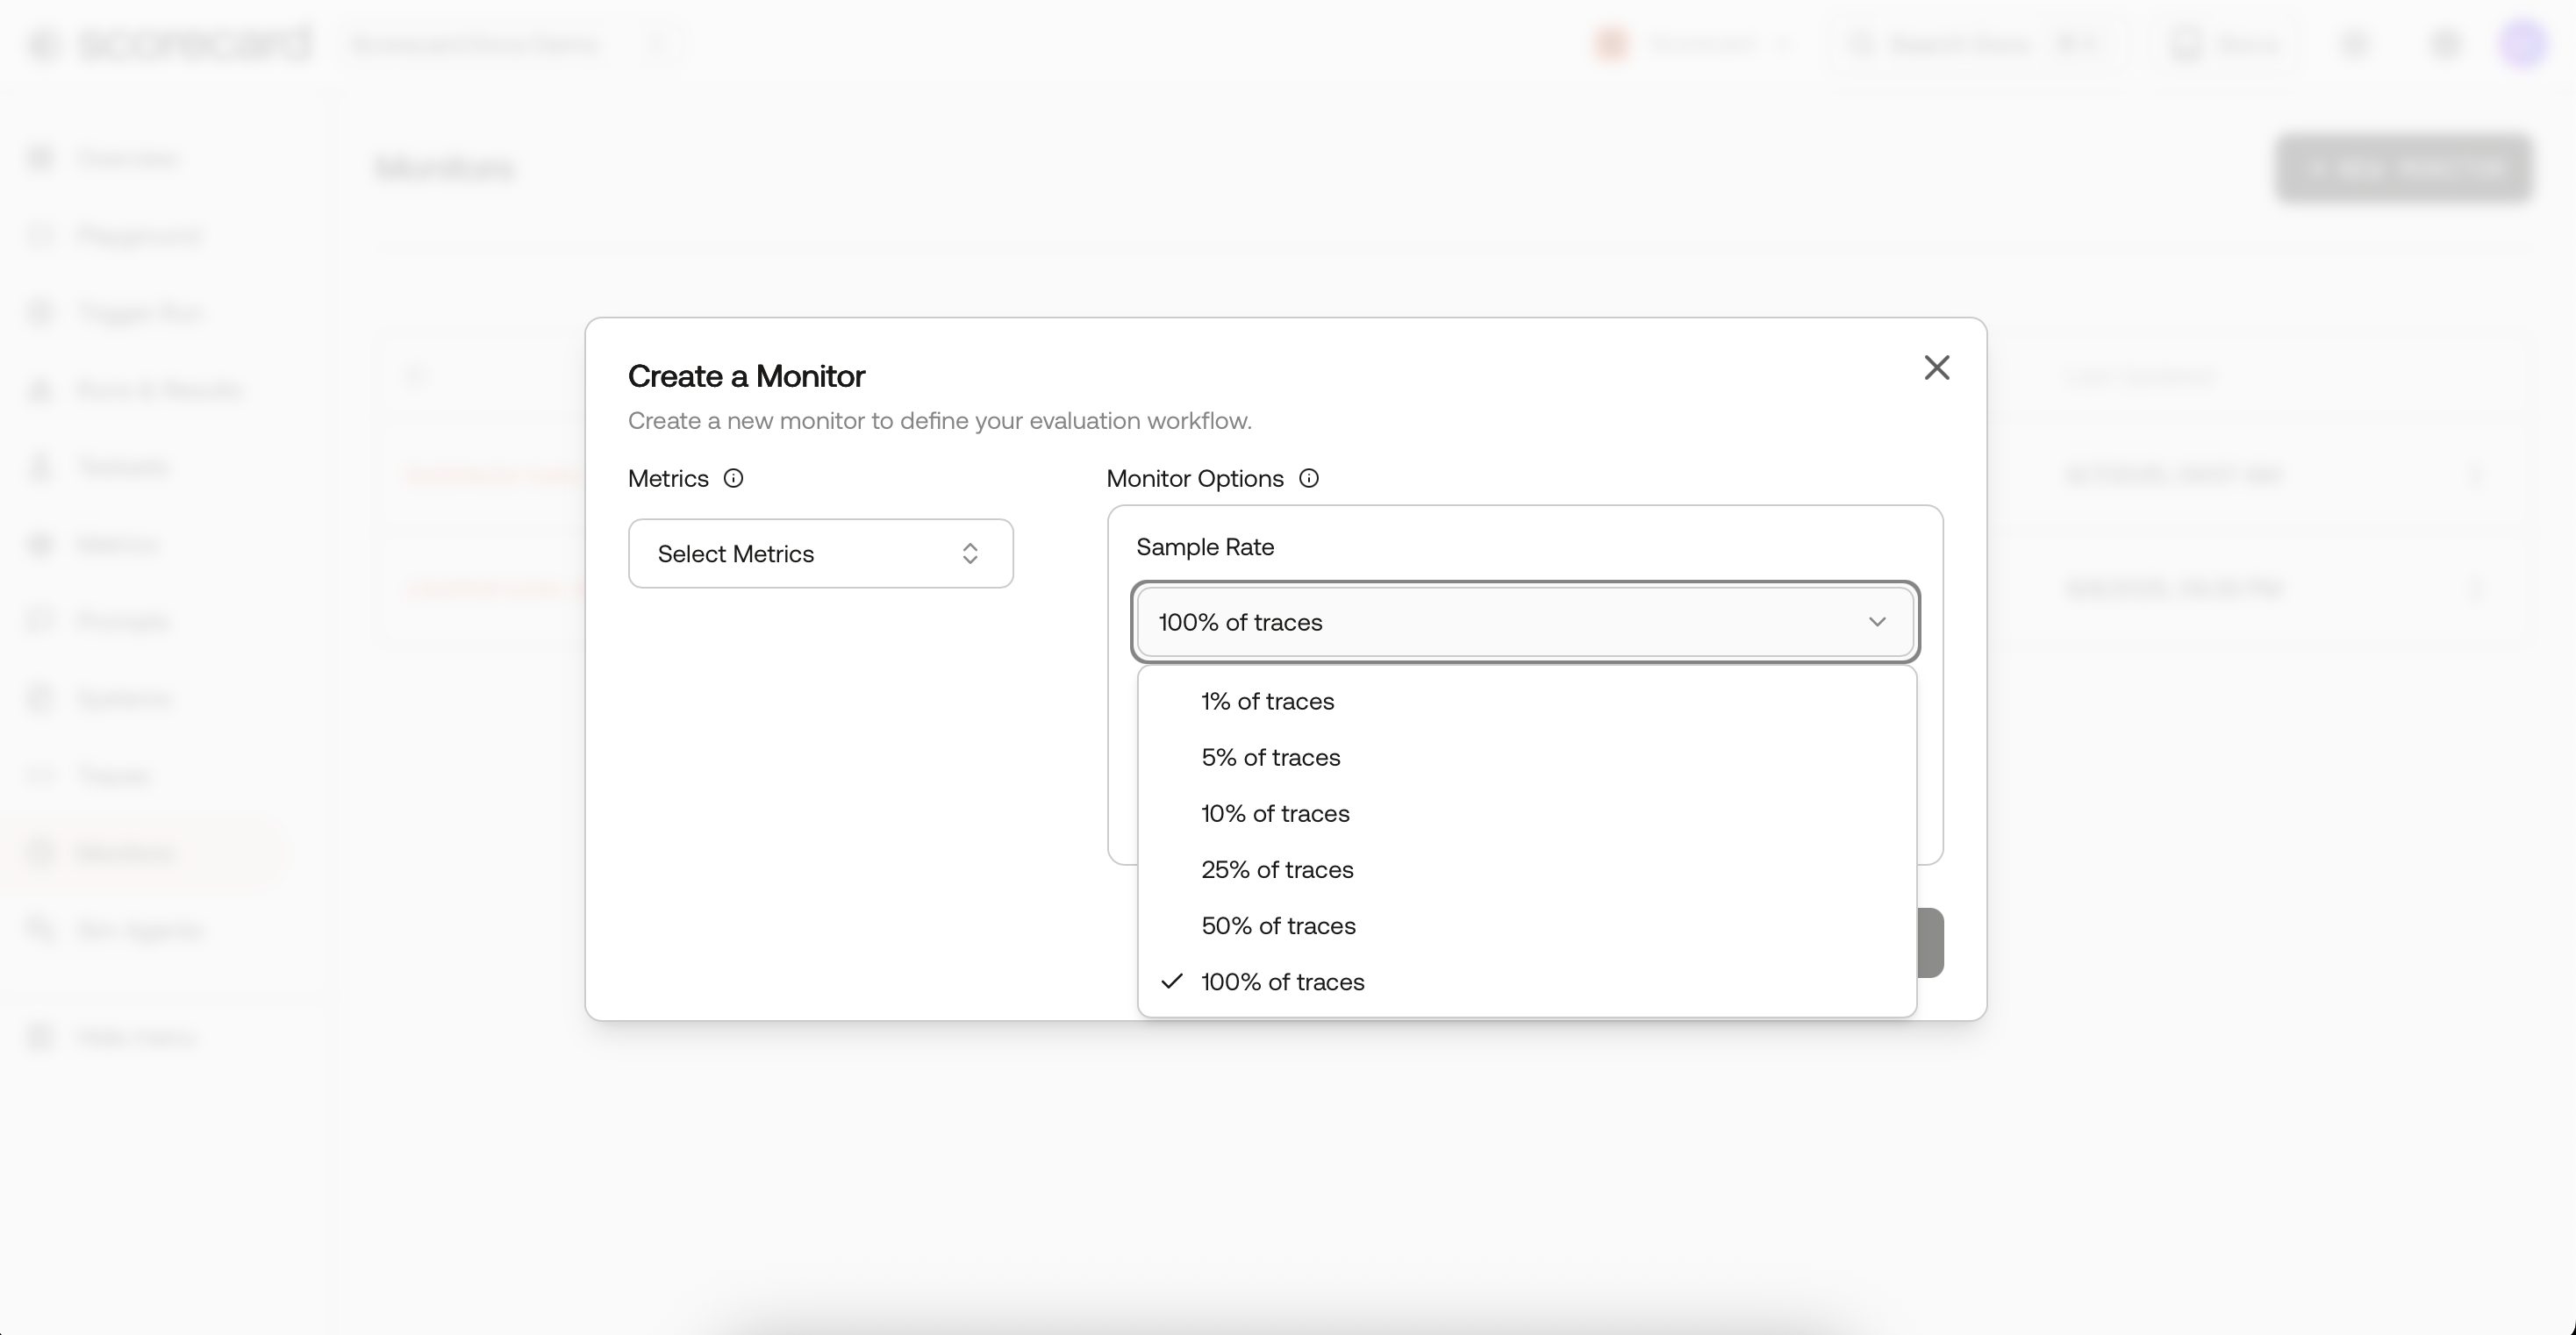 Filters
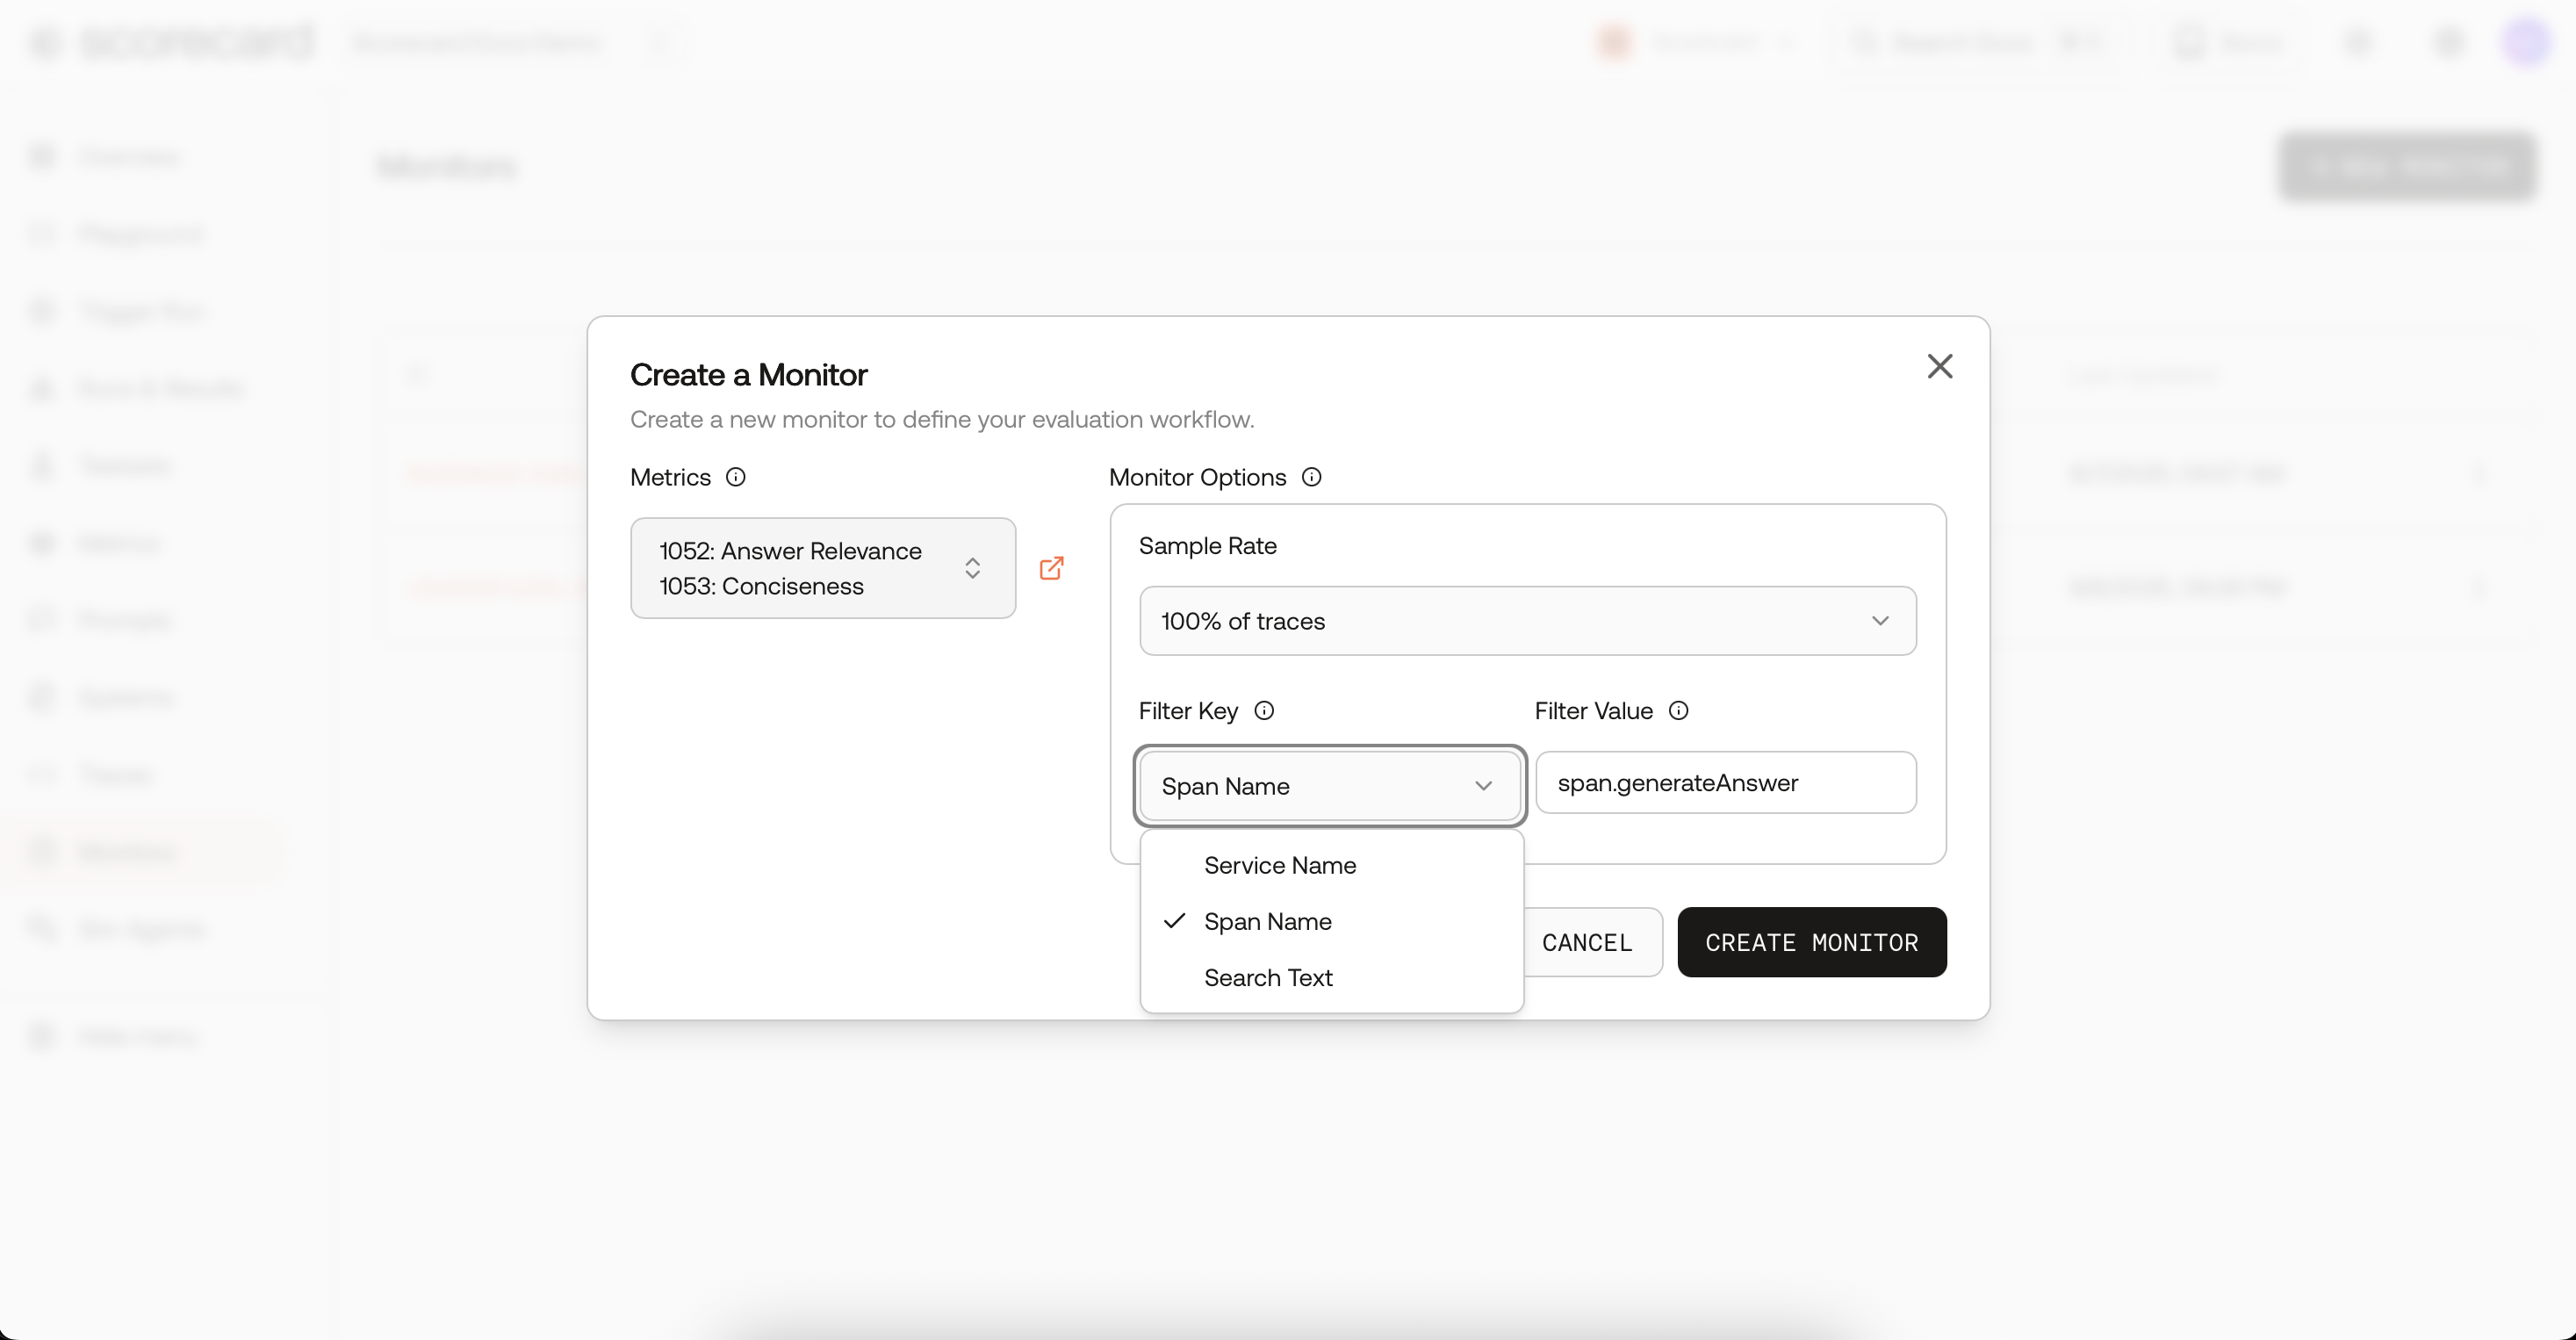 Rule of Thumb: Filtering for GenAI SpansYour monitor must match GenAI spans:
- Select the project that receives production traces (same one used in the tracing quickstart).
- Pick the metrics you want to run continuously (toxicity, factuality, latency, etc.).
- Set frequency (1m, 5m, 30m, 1h, 1d).
- Choose a sample rate (1 %–100 %).
- Add filters (by
spanName,serviceName, or free-text searchText). - Toggle Active to start/stop without deleting.
Create a monitor.
- Deterministic, hash-based sampling on
TraceIdgives stable slices across runs. - Large projects are automatically down-sampled according to your rate.
Monitor options – sample & filter.
- Narrow evaluation by span name, service name, or free-text search across span/resource attributes.
- Use SearchText to target keywords and phrases that appear anywhere in a trace (including prompts and responses). Examples: “refund policy”, “PCI”, “unsafe content”, “billing migration”. This lets you monitor a topic, incident, or cohort end-to-end and measure quality improvements precisely where they matter.
Monitor options – sample & filter.
- Spans need at least one
gen_ai,llm., ortraceloopattribute to be captured - Your monitor filter must match these GenAI spans (not their parent spans)
- Filter by service name - catches all GenAI spans within that service
- Filter by specific span name - target the exact span that has GenAI attributes (ideally with proper IO)
- ✅
{"serviceName": "my-service"}- catches all GenAI spans in the service - ✅
{"spanName": "llm-call"}- catches the specific GenAI span named “llm-call” - ❌
{"spanName": "workflow"}- won’t work if “workflow” is a parent span without gen_ai attributes
openinference.*, ai.prompt / ai.response, and gen_ai.*. Custom keys can be mapped in the UI.Once a GenAI span is captured, IO extraction is forgiving:- ✅ Best case: Has proper IO attributes (
gen_ai.prompt.*,gen_ai.completion.*) → extracts structured IO - ✅ Fallback case: Missing IO attributes → automatically uses full trace as input/output
Your traces should follow the same conventions used by OpenInference / gen_ai ecosystems (e.g., Traceloop, OpenLLMetry). If you don’t see monitoring or scoring results:
- Inspect a span in the Traces page and verify it contains prompt and completion under keys like
openinference.input/openinference.output,ai.prompt/ai.response.*, orgen_ai.prompt.*/gen_ai.completion.*. - Ensure those spans are within your monitor’s filters (service/span/searchText) and sampling window. Once the attributes are present, Scorecard will automatically extract and score them.
3
Where results show up
Each cycle, Scorecard samples recent AI spans, extracts inputs/outputs, creates a Run, and auto‑scores Records with your metrics.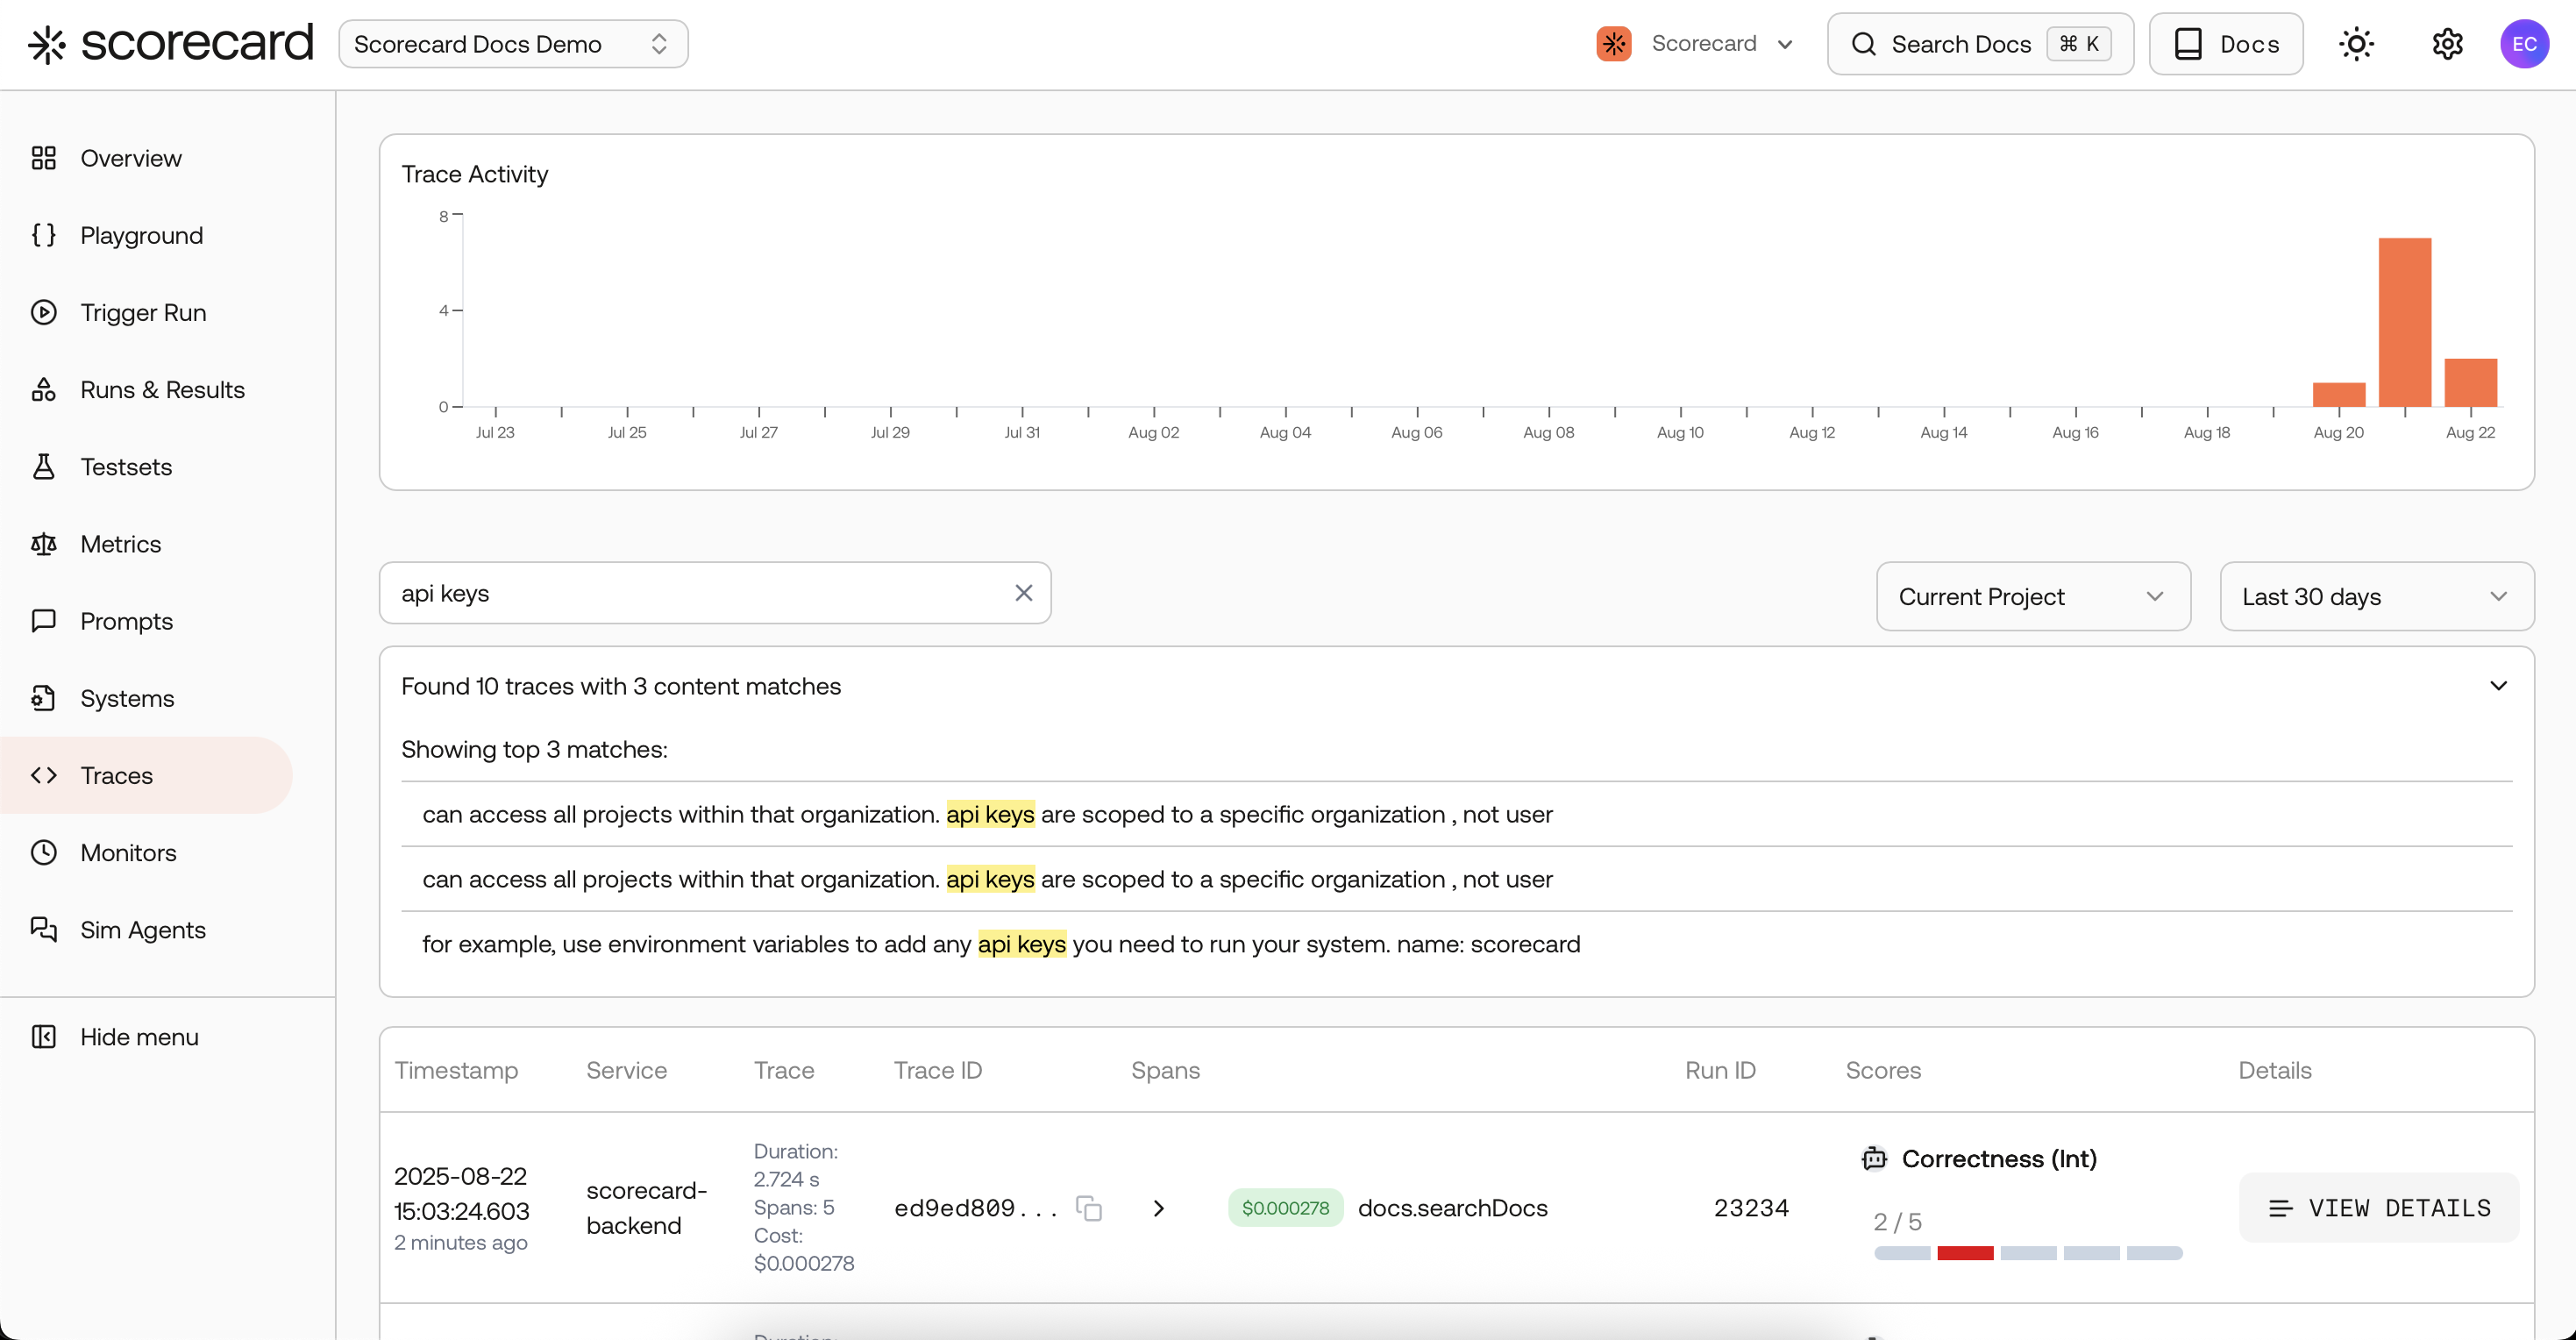
- On Traces: you’ll see scored spans inline; click a row to view the full trace and follow the link to its run.
- On Runs: you’ll find run history and per‑run aggregates (plots and stats) for deeper analysis.
Traces search page with scores created by a 'monitor'.
What’s next?
- Promote interesting spans with Trace ➜ Testcase to build datasets from production usage.
- Compare results in Runs & Results when iterating on models or prompts.
Looking for an end-to-end example? Check the open-source production monitoring sample app.