What is Analysis?
Analysis in Scorecard allows you to:- Compare Multiple Runs: View up to multiple runs simultaneously to track performance evolution
- Visualize Score Distributions: See how scores are distributed across different metrics and runs
- Inspect Individual Records: Drill down into specific test cases to understand outputs and scoring details
- Identify Patterns: Spot improvements, regressions, and consistency issues across iterations
Navigating to Analysis
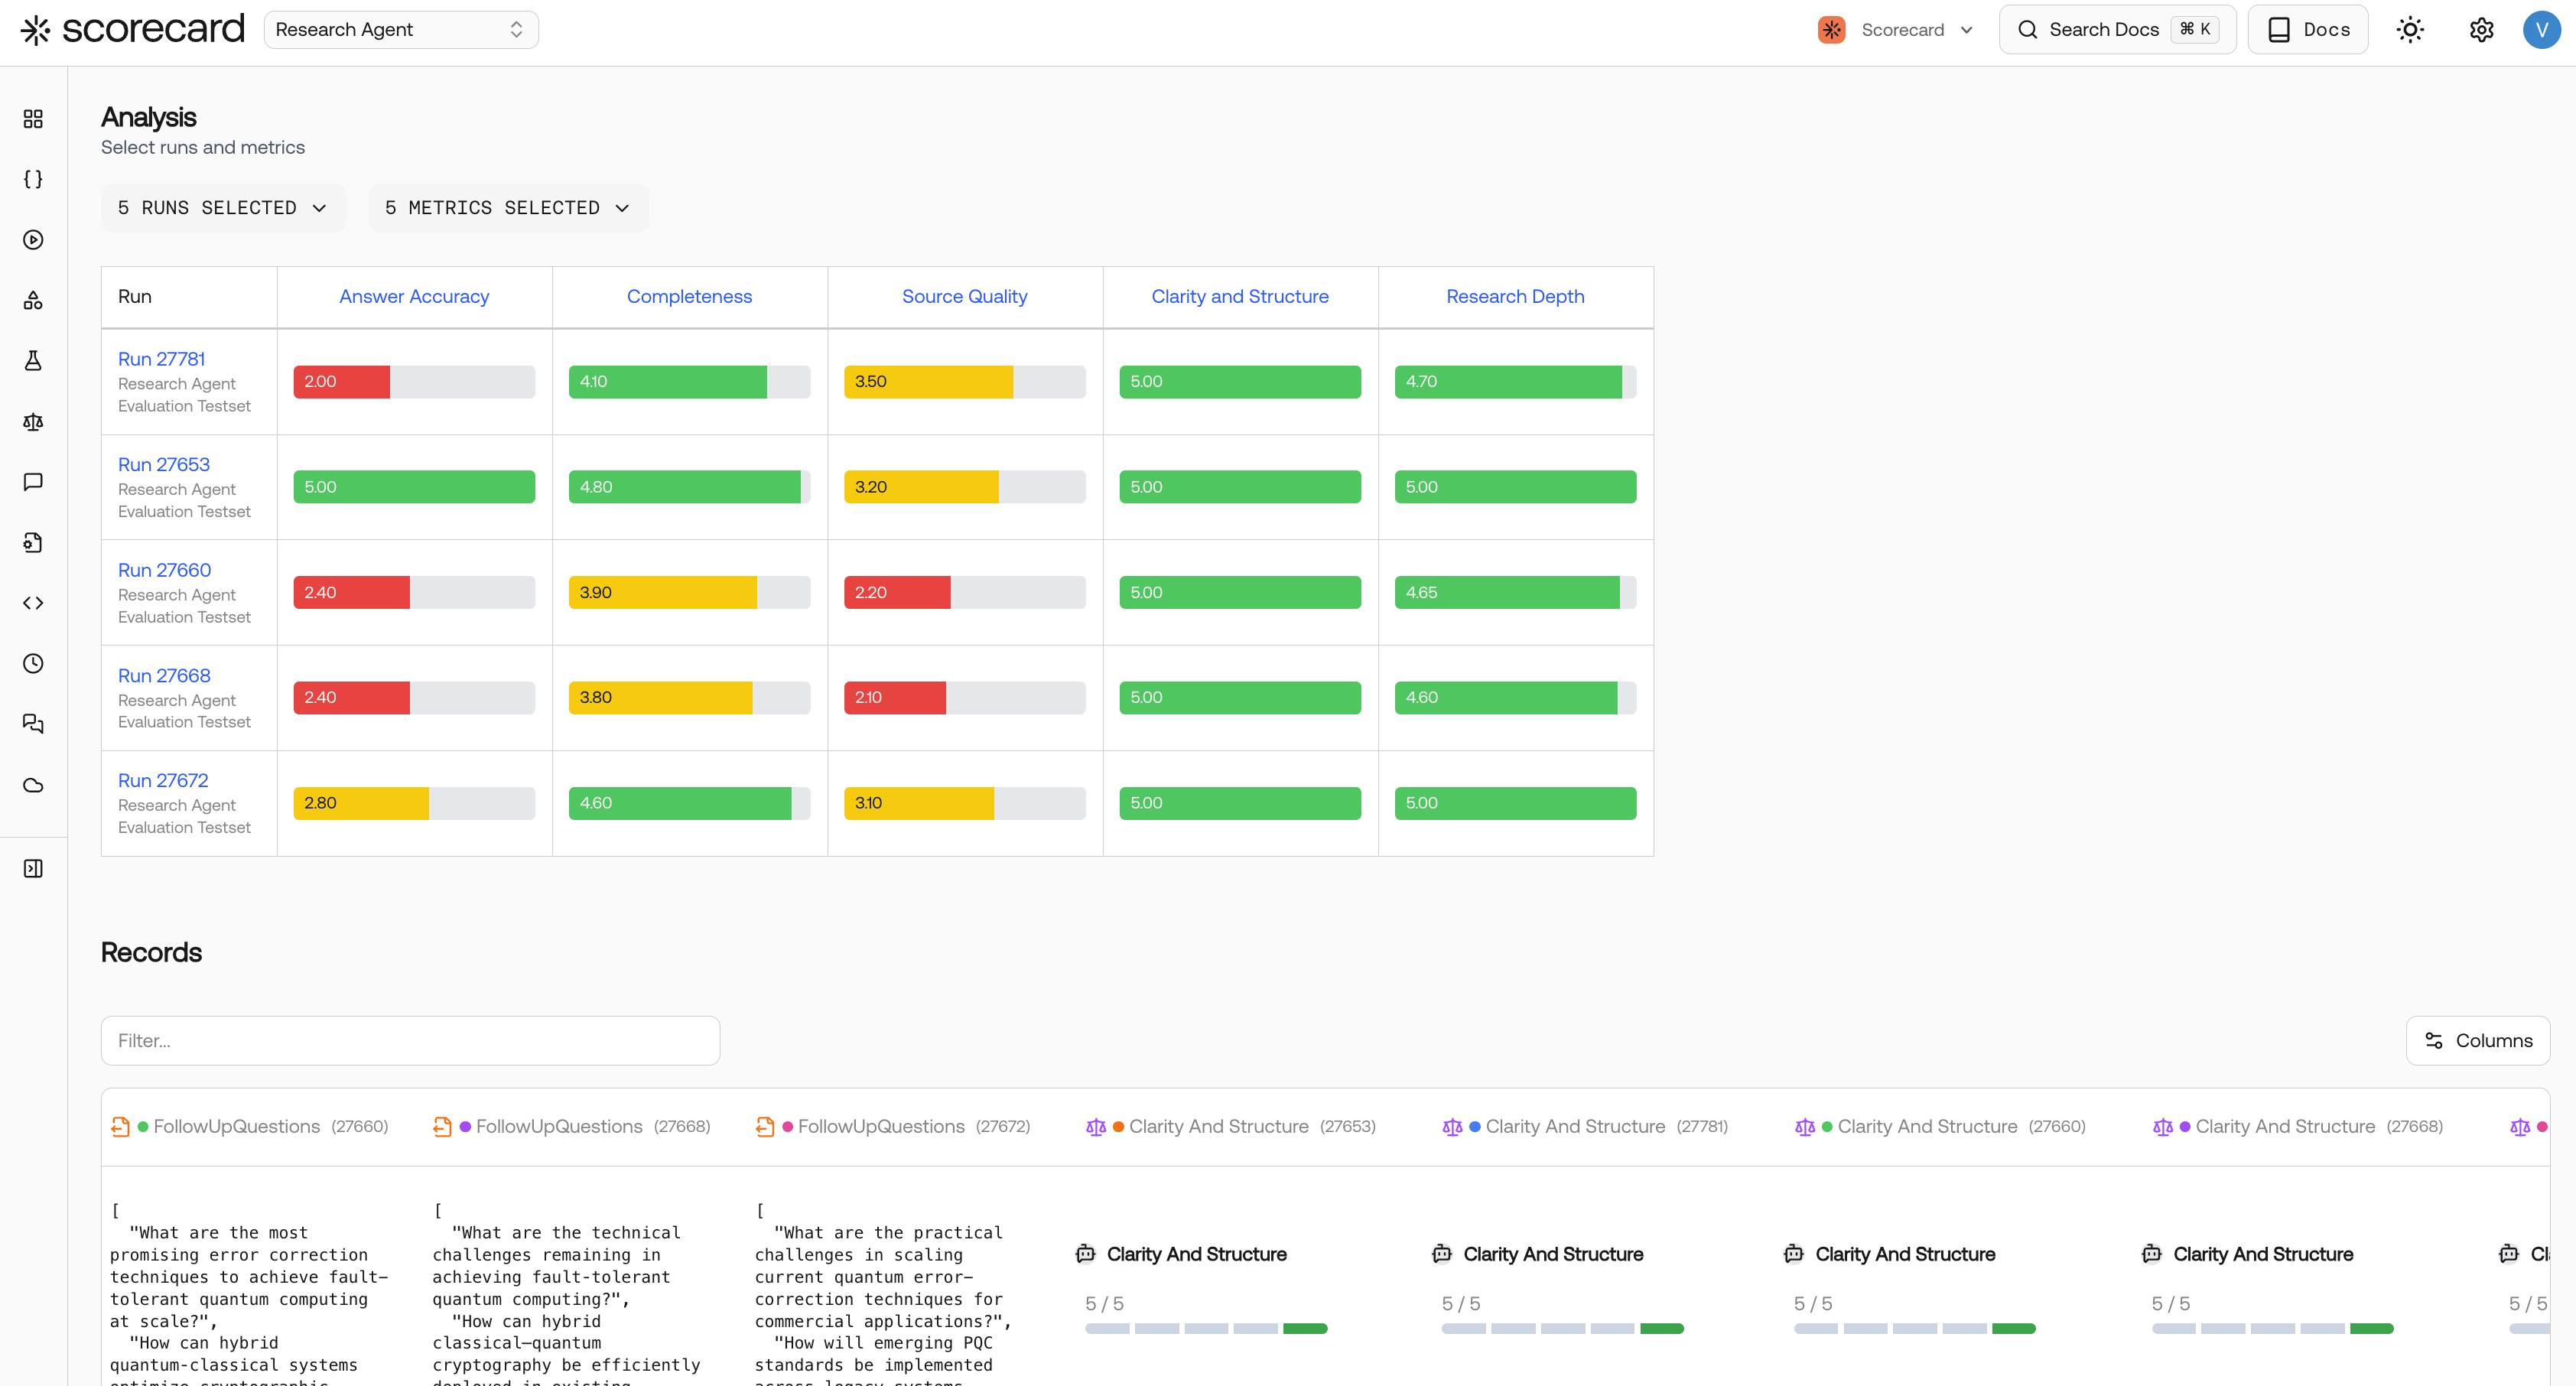
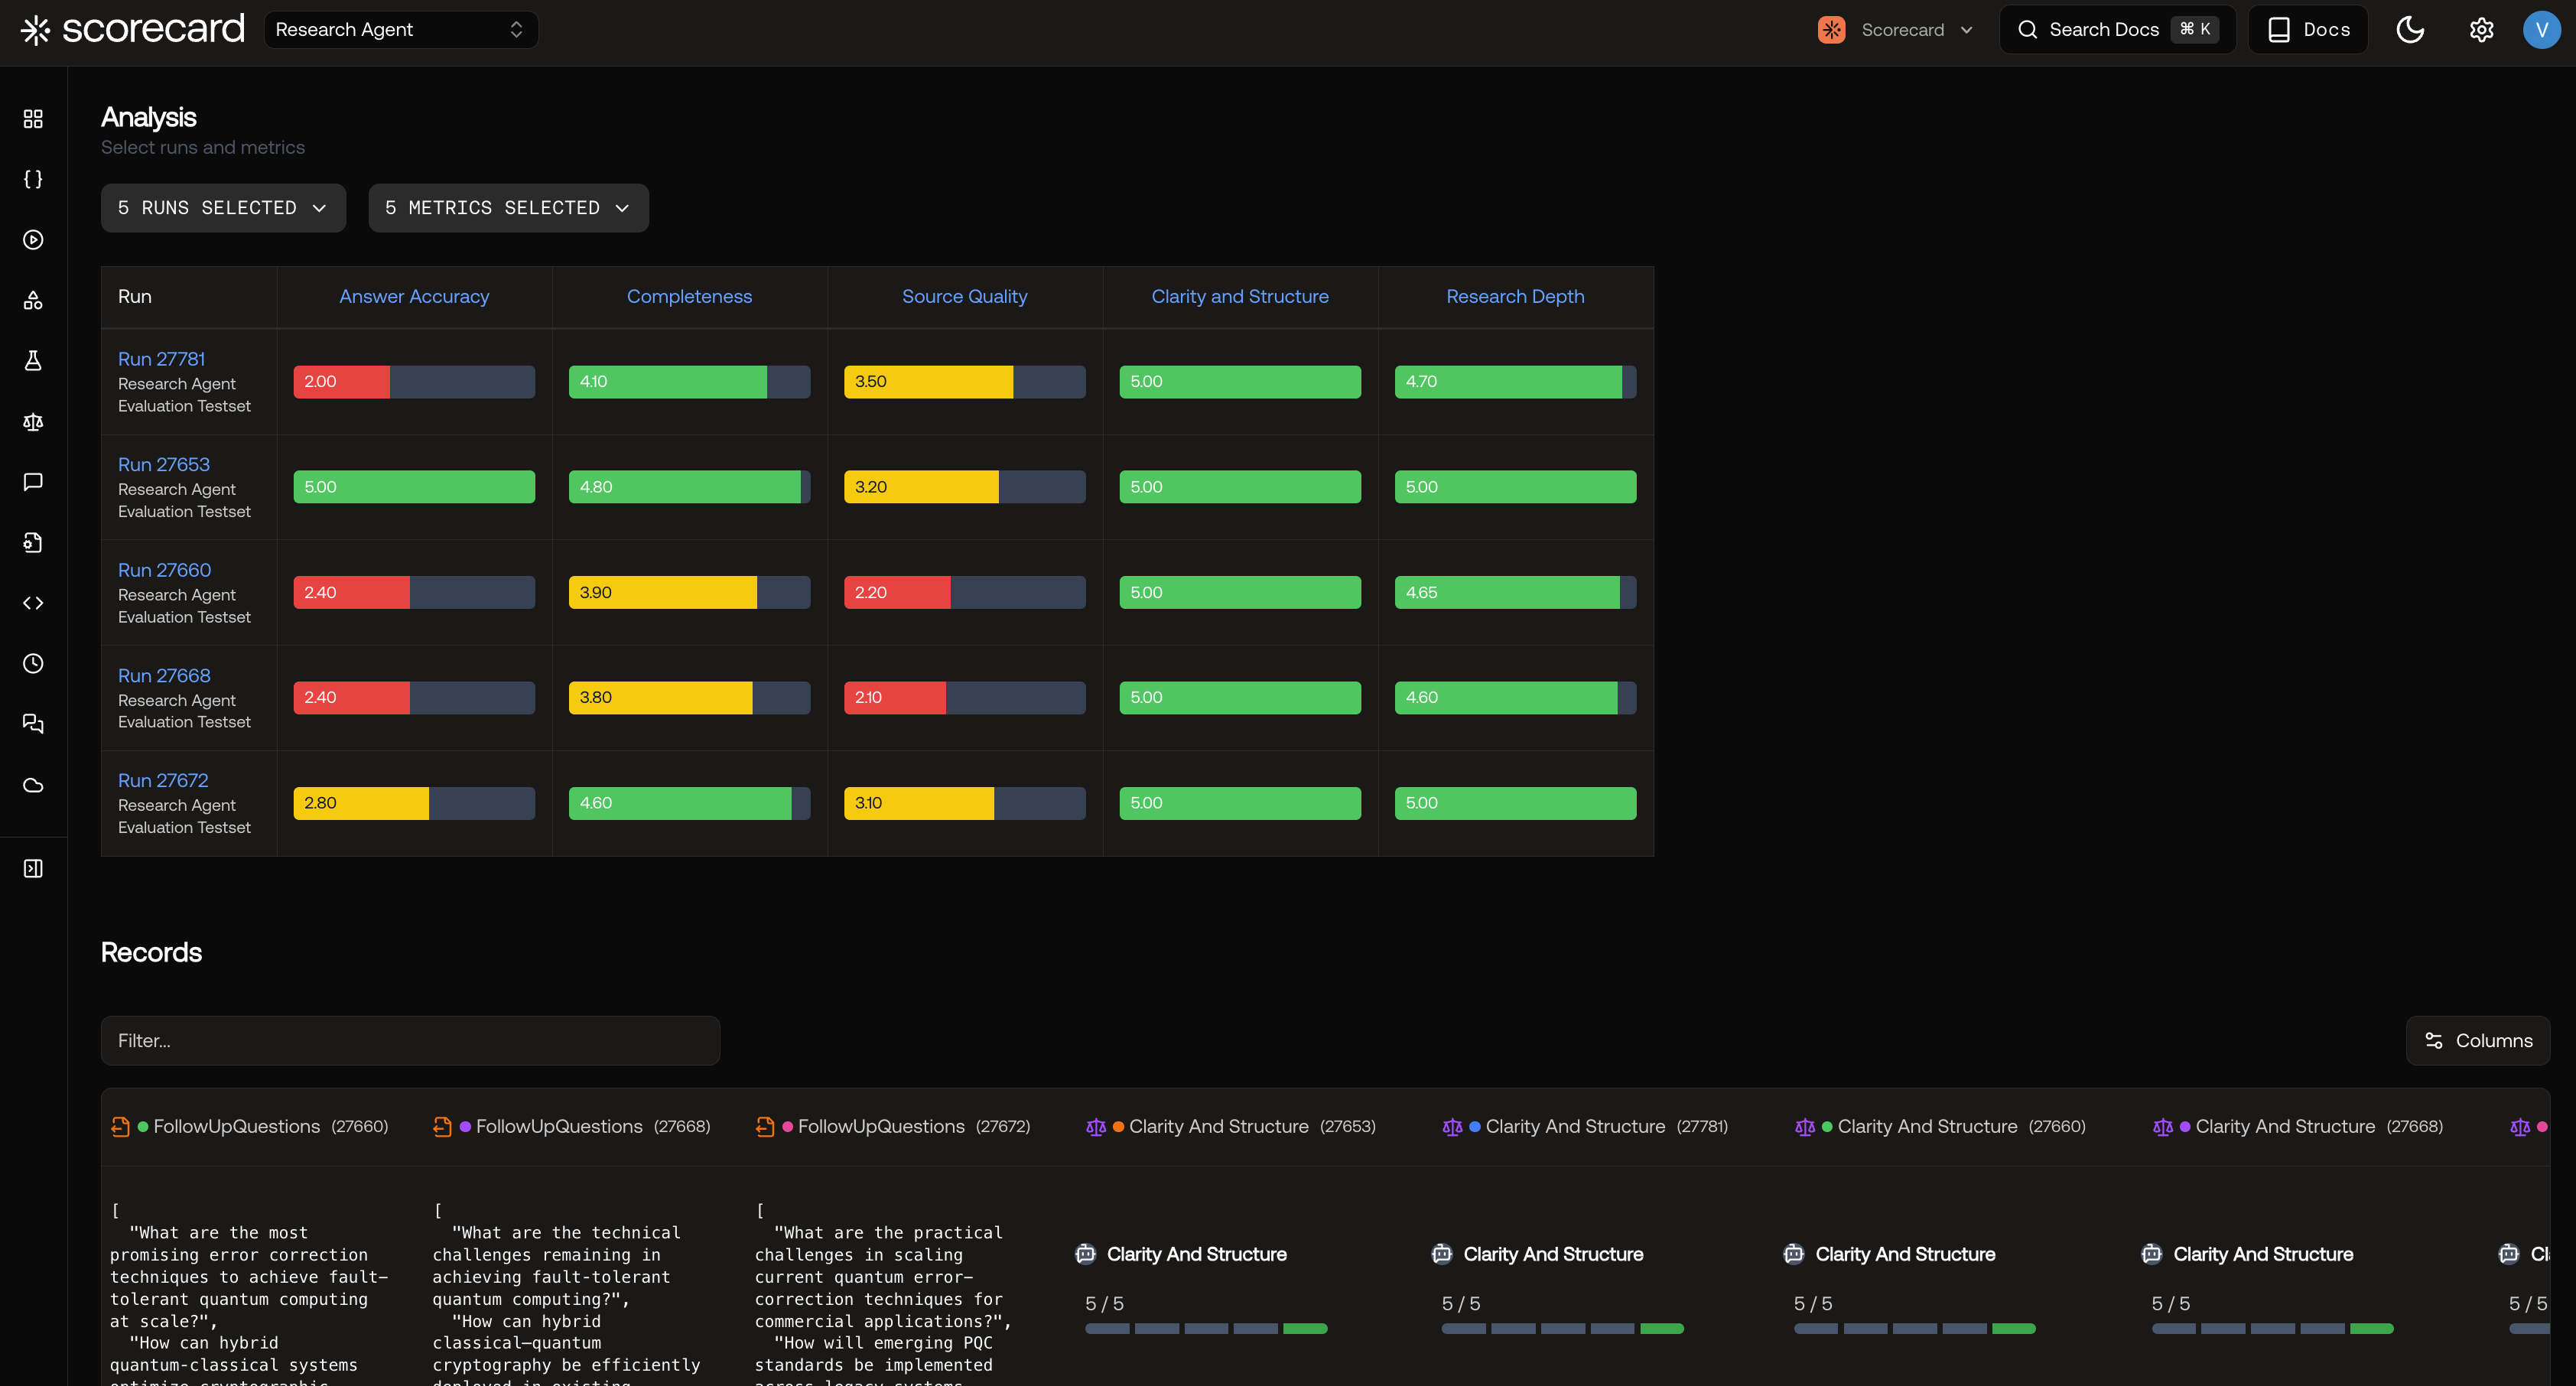
You can access the Analysis page from the Runs list page by selecting the runs you want to compare and clicking the Analyze button.Understanding Score Distributions
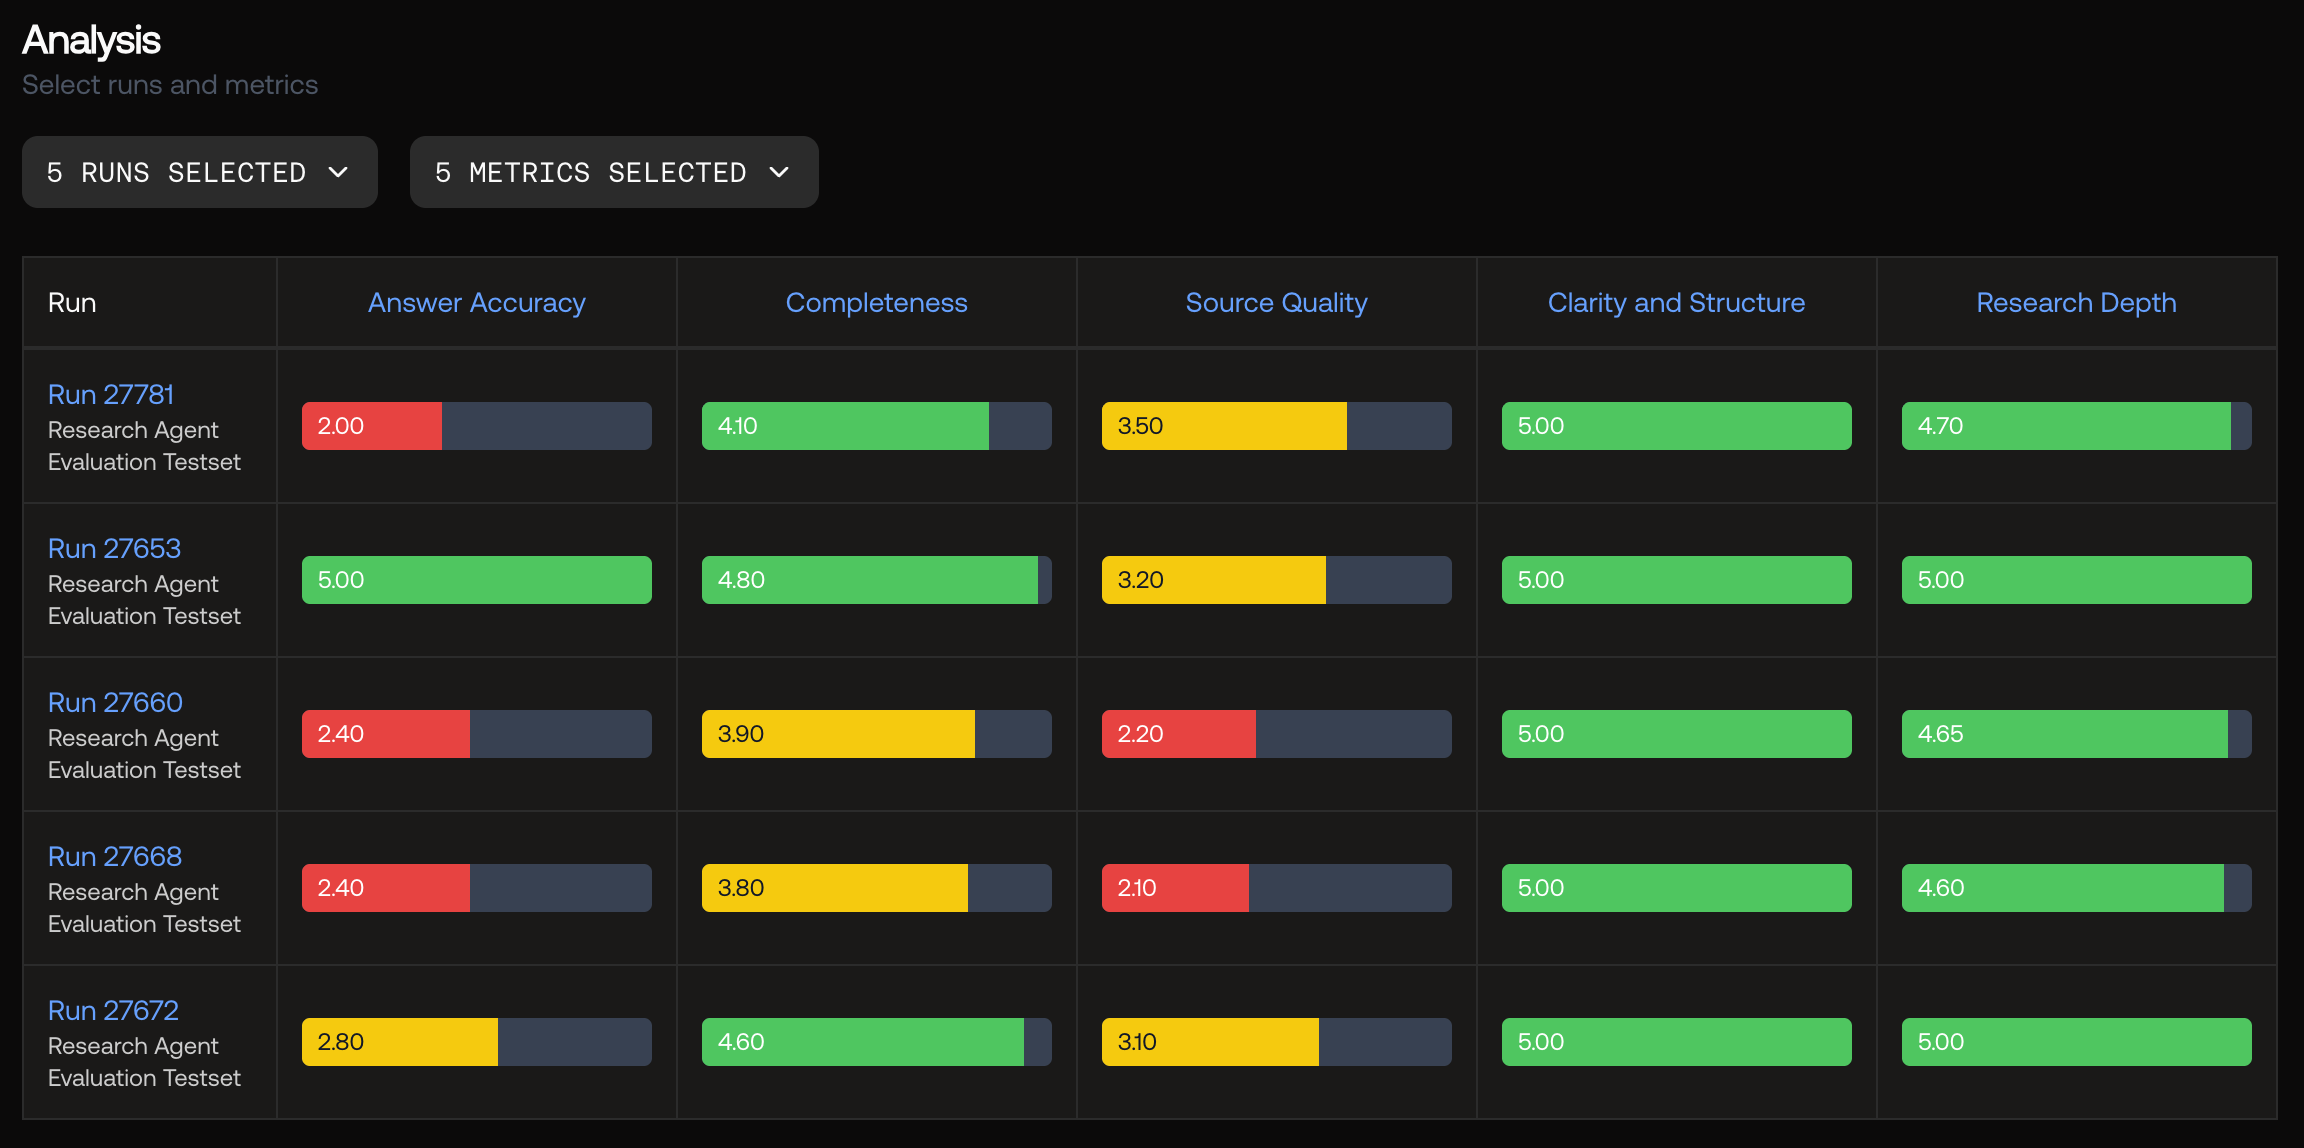
The score distribution matrix provides an at-a-glance view of performance across your selected runs and metrics.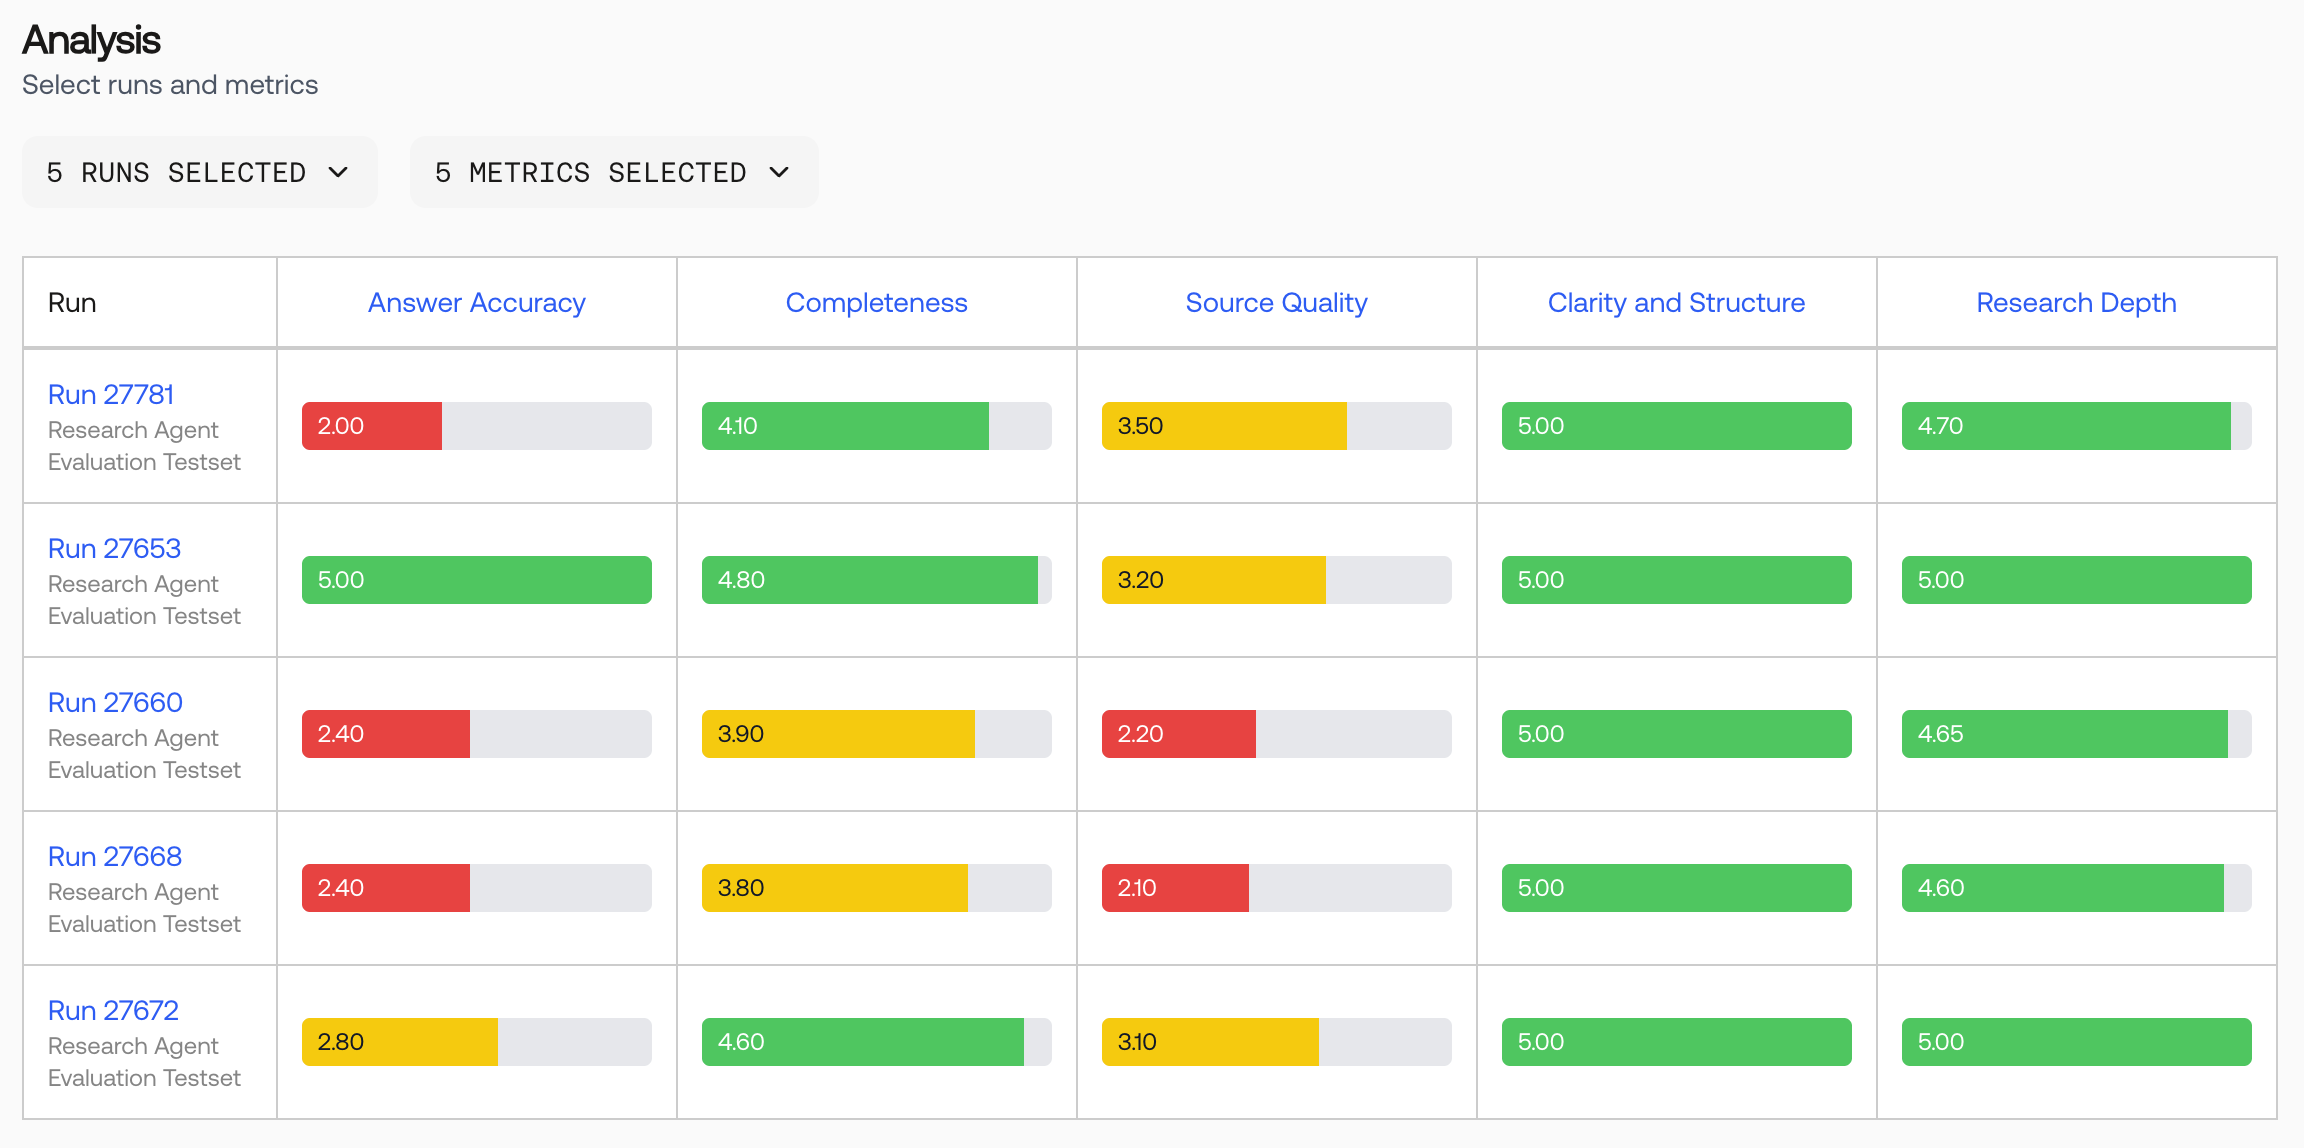
Detailed Records Table
Below the score distribution matrix, the Records Table provides granular inspection of individual test cases. The records table here is organized the same way as the run details page.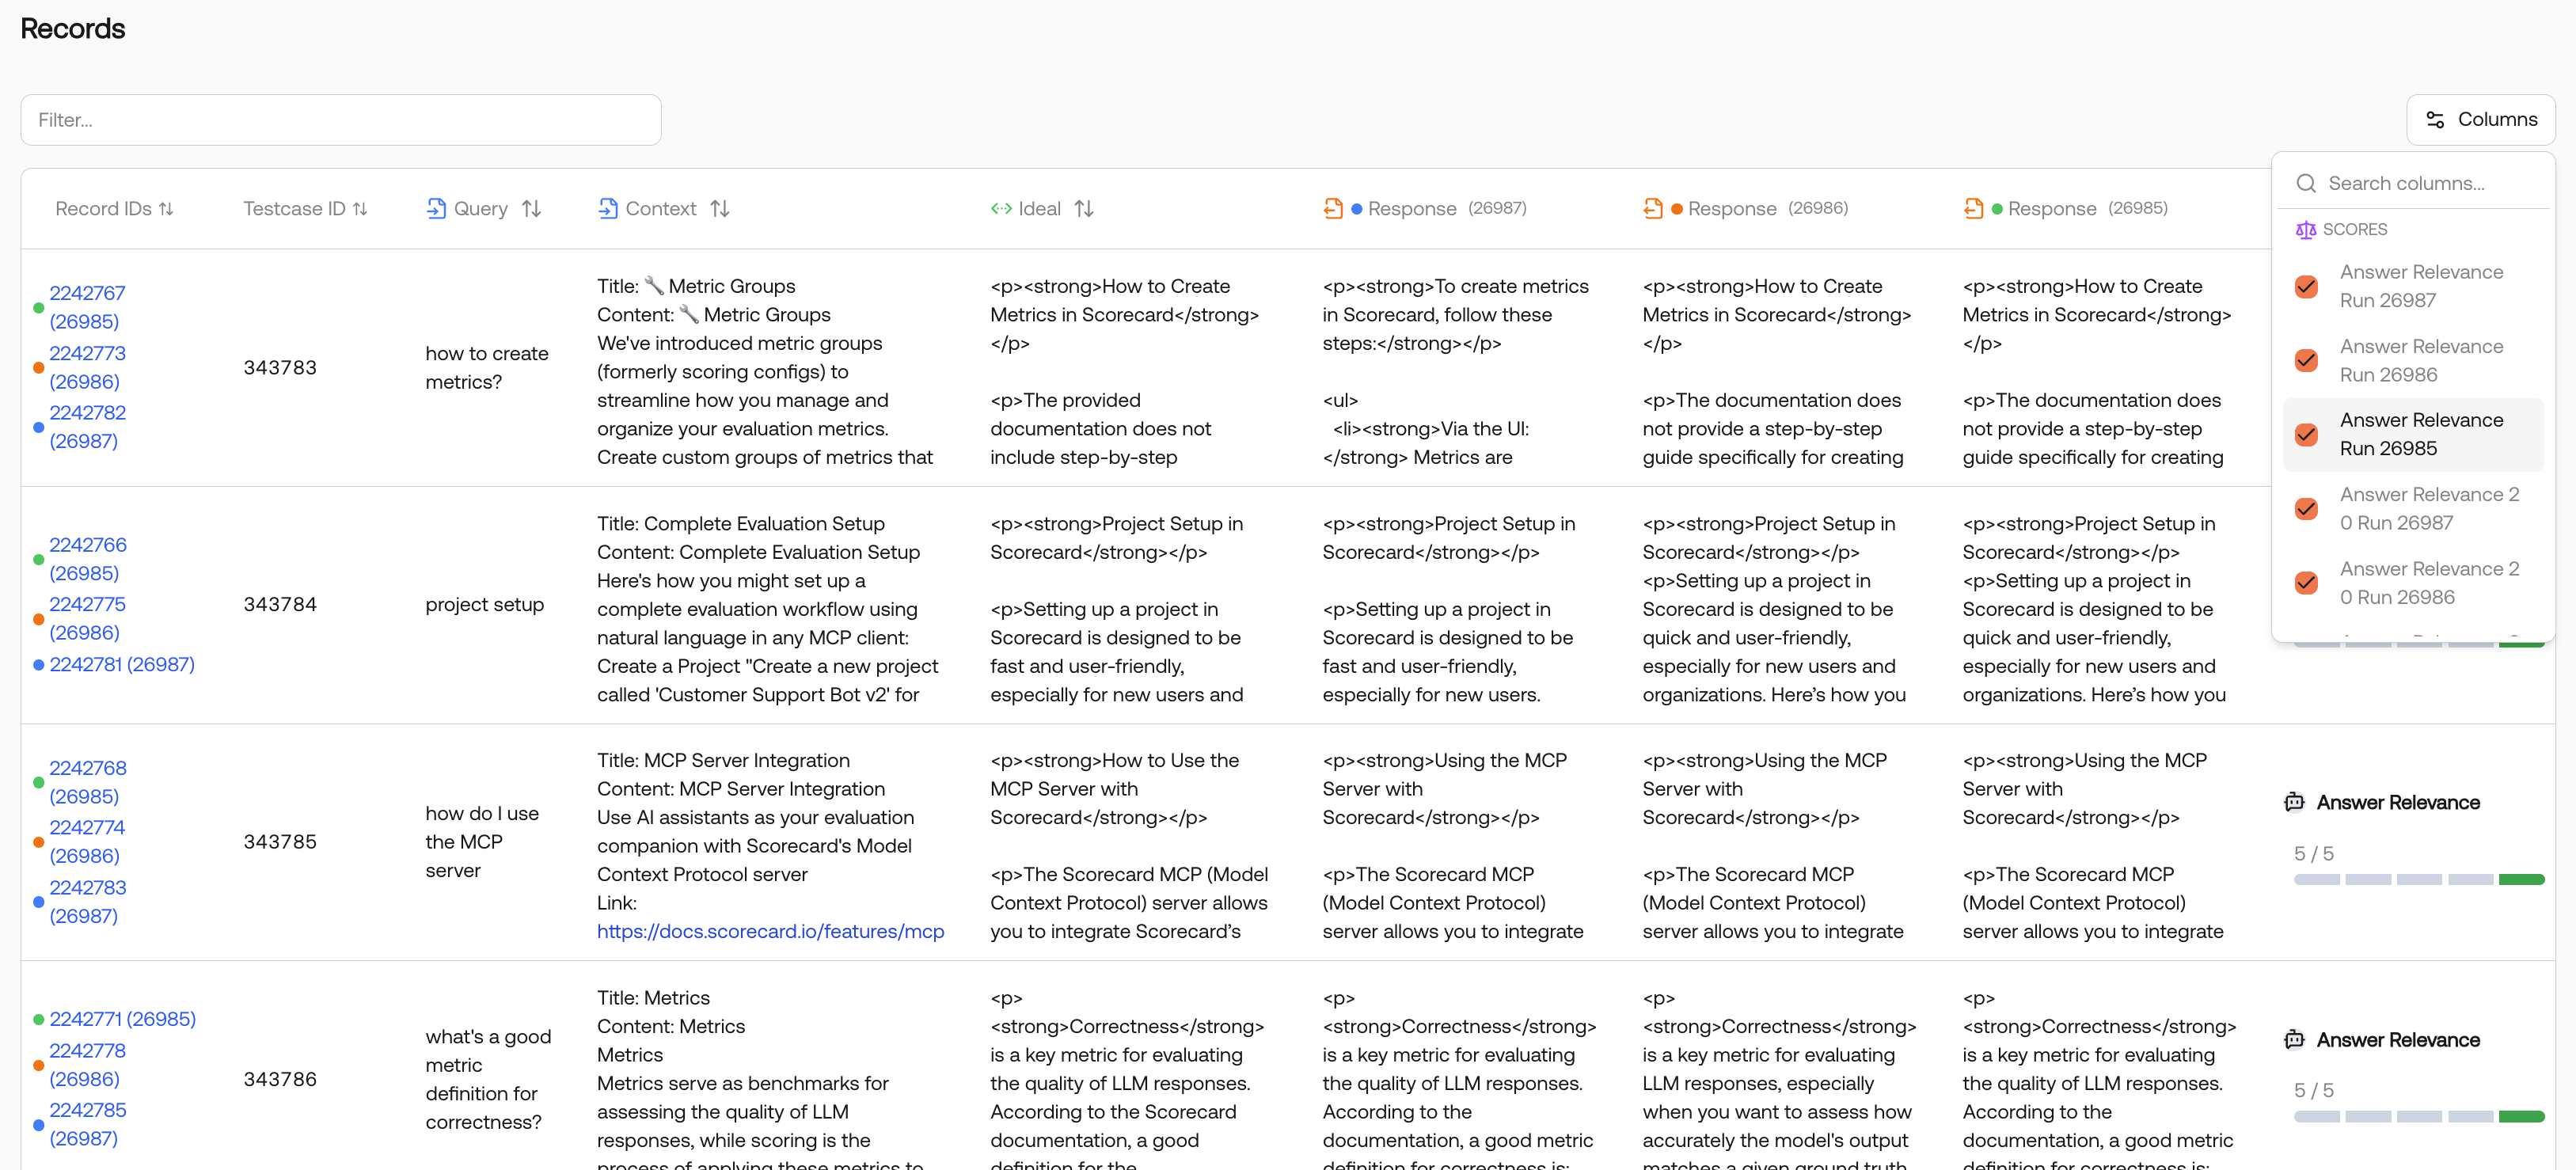
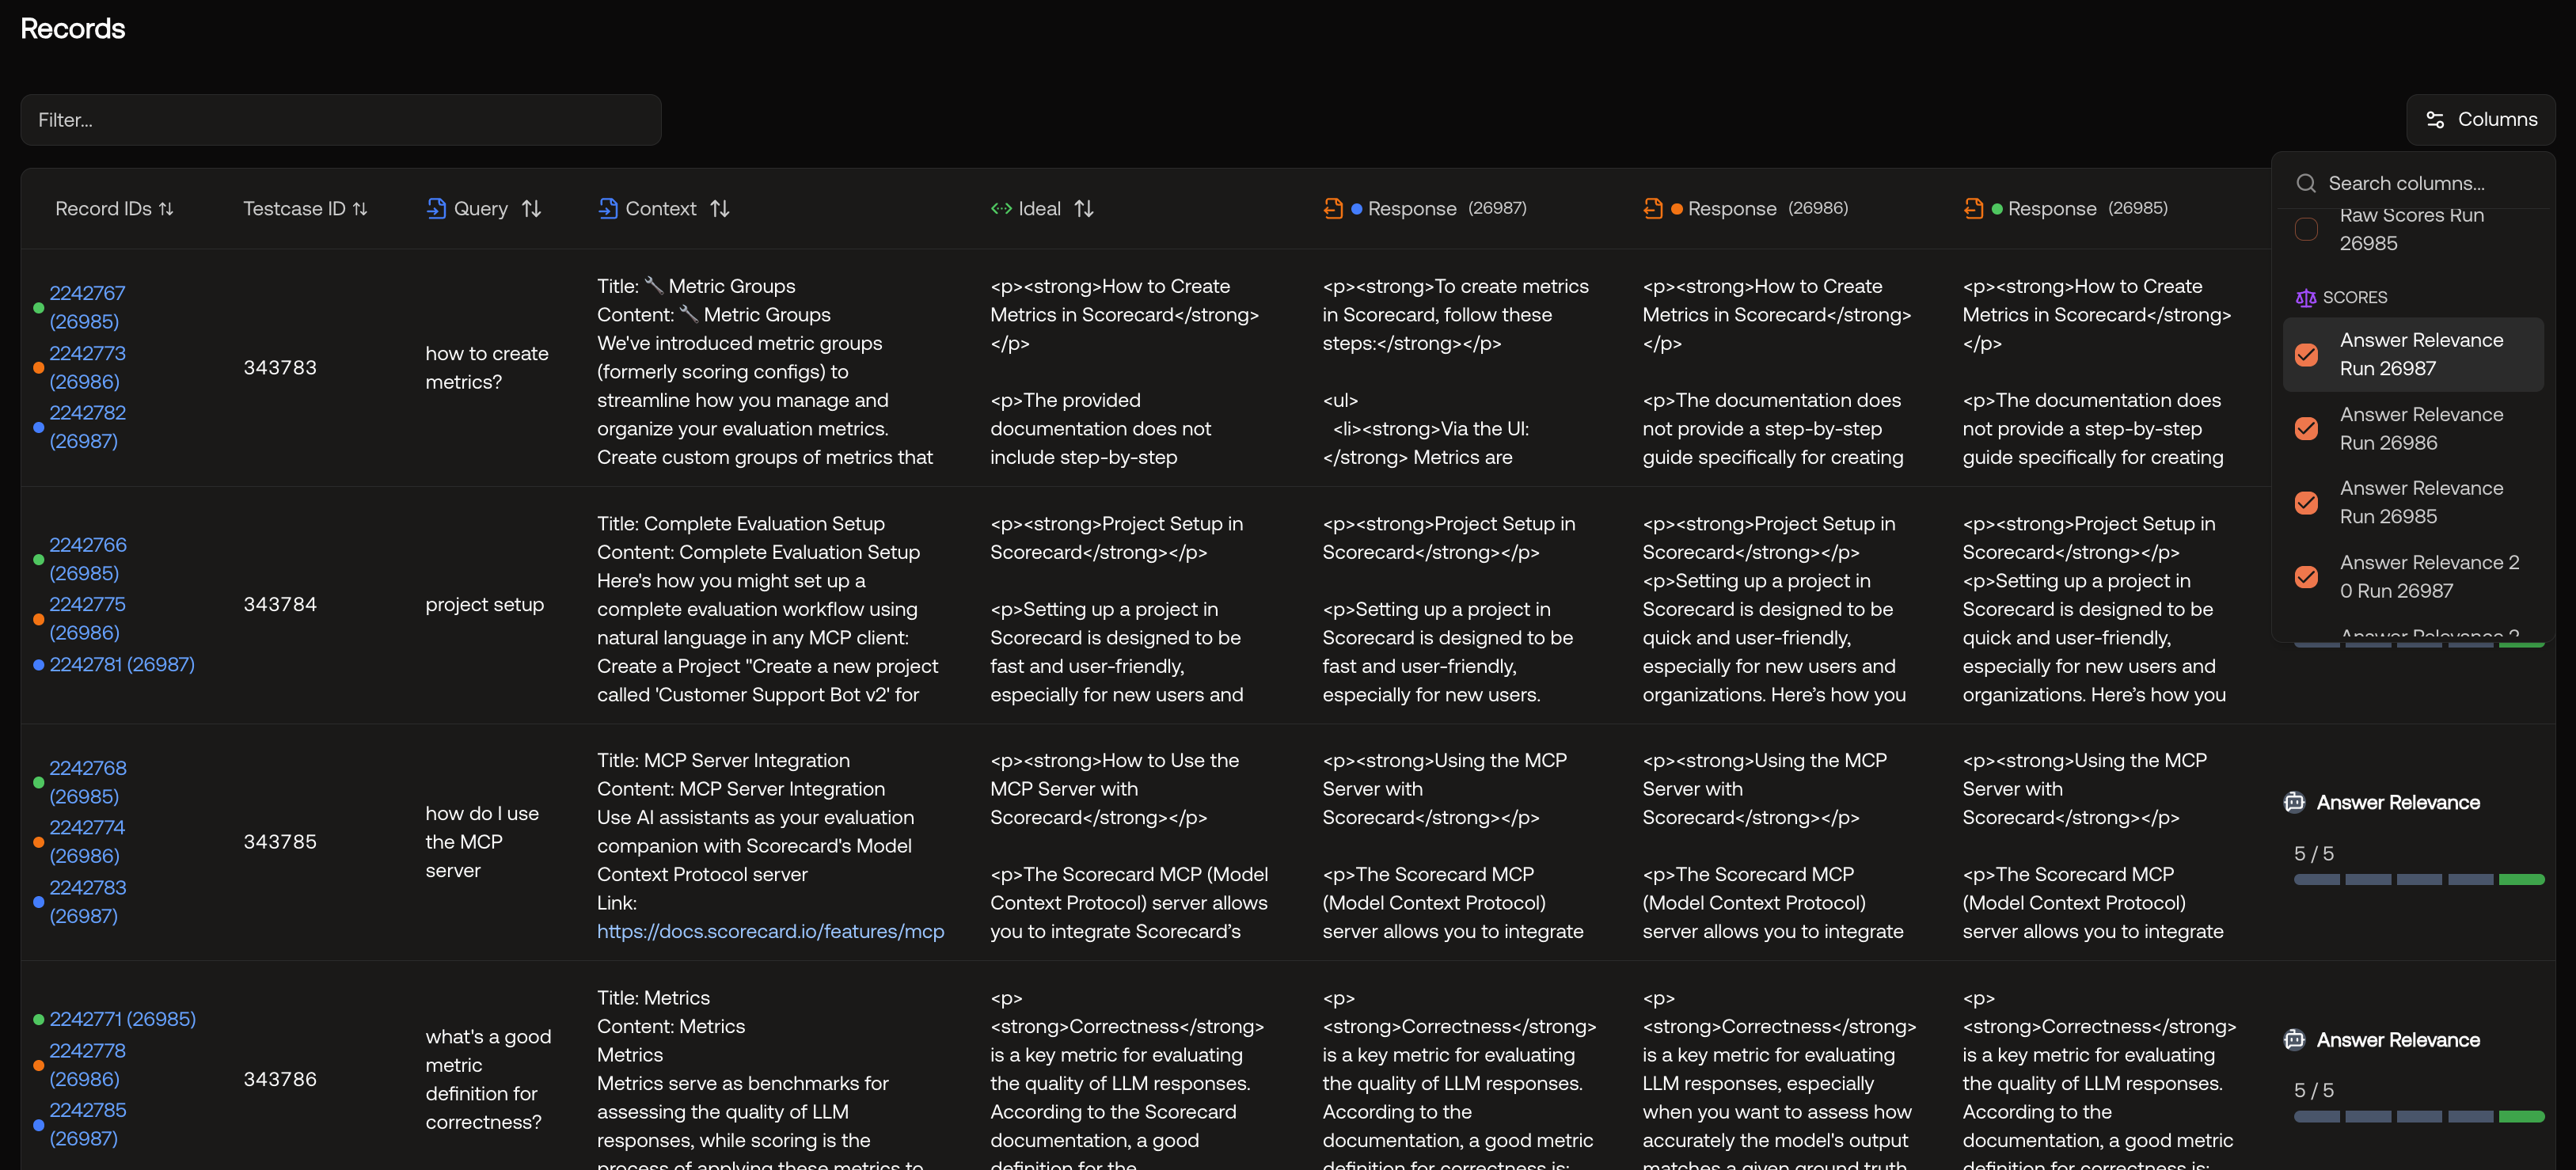
Record Deduplication
The table intelligently groups records by testcase:- With Testcase IDs: Multiple runs evaluating the same testcase appear in a single row
- Without Testcase IDs: Each record appears as a separate row
- Visual Indicators: Color-coded bars show which runs evaluated each testcase
Best Practices
Start with Recent Runs
Start with Recent Runs
Begin your analysis with the most recent runs to understand current performance, then add historical runs for trend analysis.
Compare Runs that use the same testcases
Compare Runs that use the same testcases
If your runs have the same testcases, Scorecard automatically groups records by testcase for you.
Filter records
Filter records
In the records table, you can filter records to only show those that mention a keyword in the inputs, outputs, or expected outputs.
Examine Outliers
Examine Outliers
Pay special attention to testcases where scores vary significantly between runs. These often reveal important insights. Is it a challenging or incorrect testcase? Are your metric guidelines underspecified? Has your system regressed in a particular area?
Document Findings with Run Notes
Document Findings with Run Notes
Use run notes to document what you learn from analysis sessions for future reference.
Common Use Cases
Performance Regression Detection
Quickly identify when changes to your system have negatively impacted performance:- Select your current production run as baseline.
- Add the latest development run for comparison.
- Look for metrics showing decreased scores (red or yellow where previously green).
- Drill into specific records to understand what changed.
Multi-Model Comparison
Compare different models or configurations:- Run the same testset with different models.
- Select all model runs in the Analysis page.
- Compare score distributions to identify the best performer.
- Examine specific outputs to understand quality differences.
Metric Validation
Verify that your metrics are working correctly:- Select runs with known good and bad outputs.
- Choose the metrics you want to validate.
- Verify that scores align with expected quality assessments.
- Adjust metric configurations if needed.
System Evolution Tracking
Monitor how your system improves over time:- Select runs from different development phases.
- Focus on your primary success metrics.
- Observe the trend in score distributions.
- Document improvements in run notes.