Overview
During AI agent development, you’ll frequently iterate on your agent to achieve optimal performance. Whether you’re tweaking model parameters, testing different model versions, or refining prompts, each change affects your agent’s output quality. However, with multiple iterations, it becomes challenging to accurately quantify and compare the effectiveness of your changes. Scorecard’s A/B Comparison feature solves this by providing side-by-side run comparisons, giving you clear, data-driven insights into your improvements.Requirements: Only runs using the same Testset can be compared with each other.
Why Use A/B Comparisons?
Data-Driven Decisions
Move beyond gut feelings with quantitative metrics that show exactly how changes impact performance.
Experiment Tracking
Easily compare different agent configurations to identify the best-performing setup.
Continuous Improvement
Validate that iterative changes actually improve your agent’s capabilities.
Production Confidence
Ensure changes to production agents, models, and prompts deliver better results.
How to Compare Runs
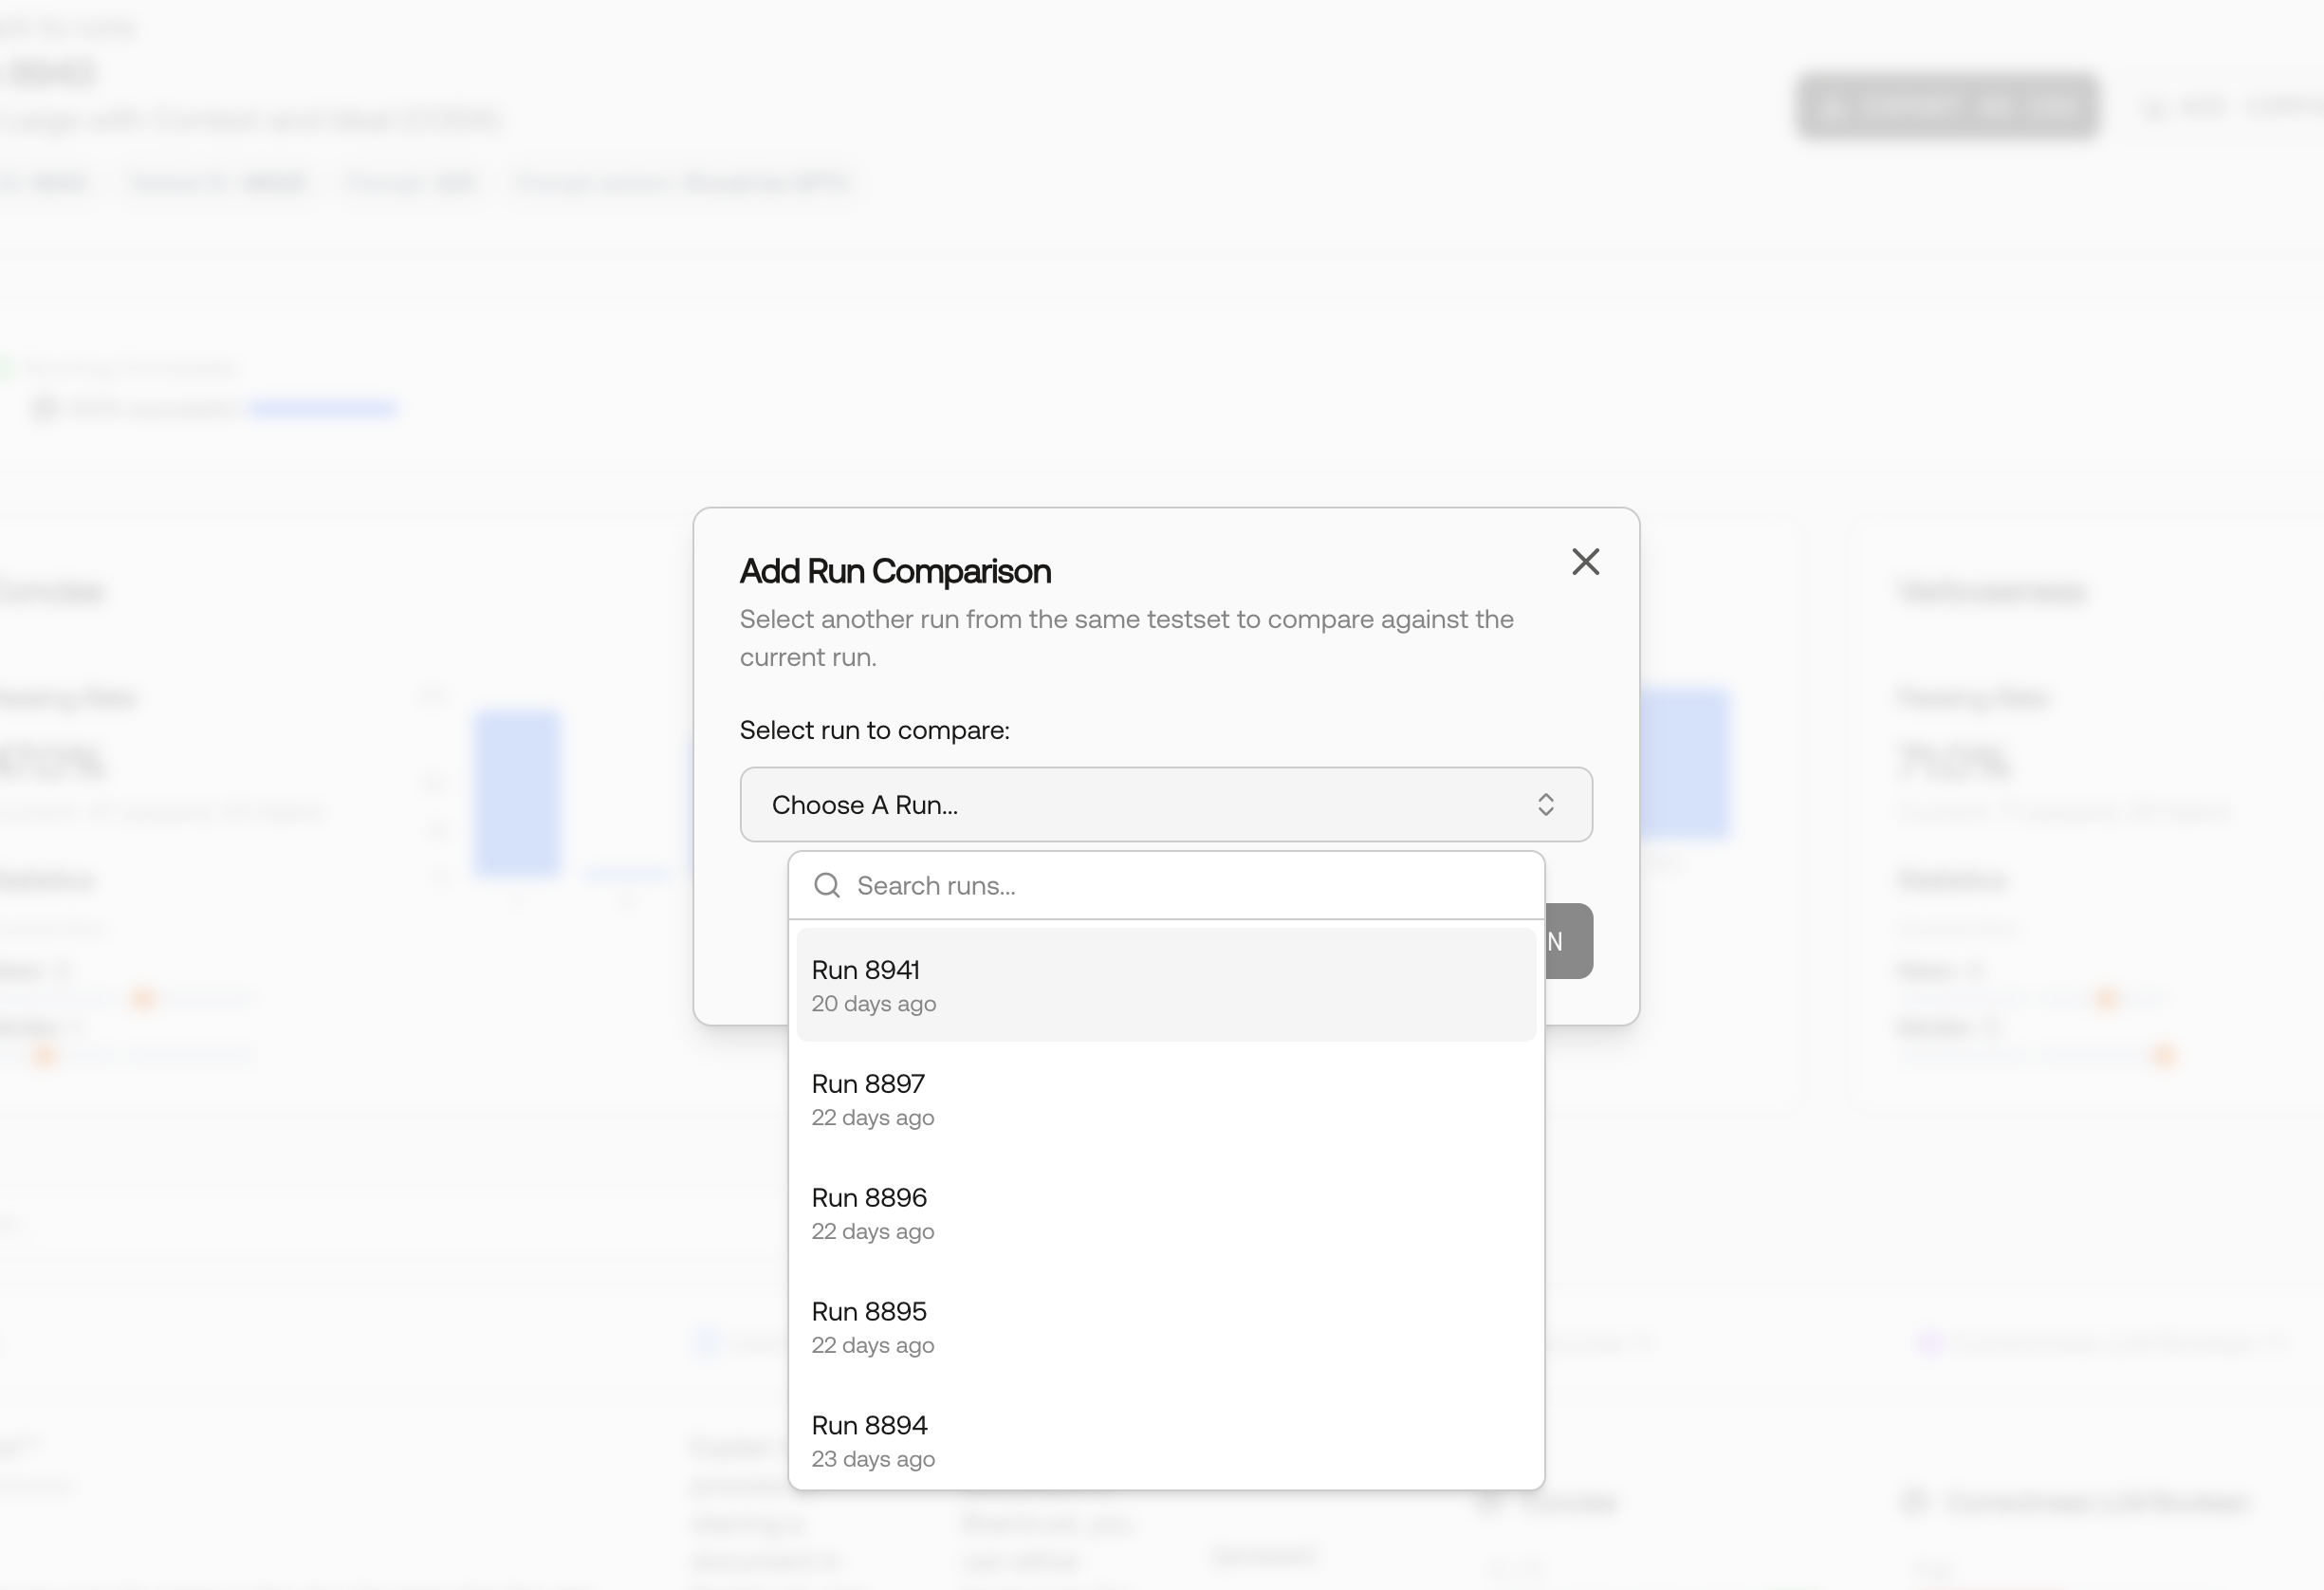
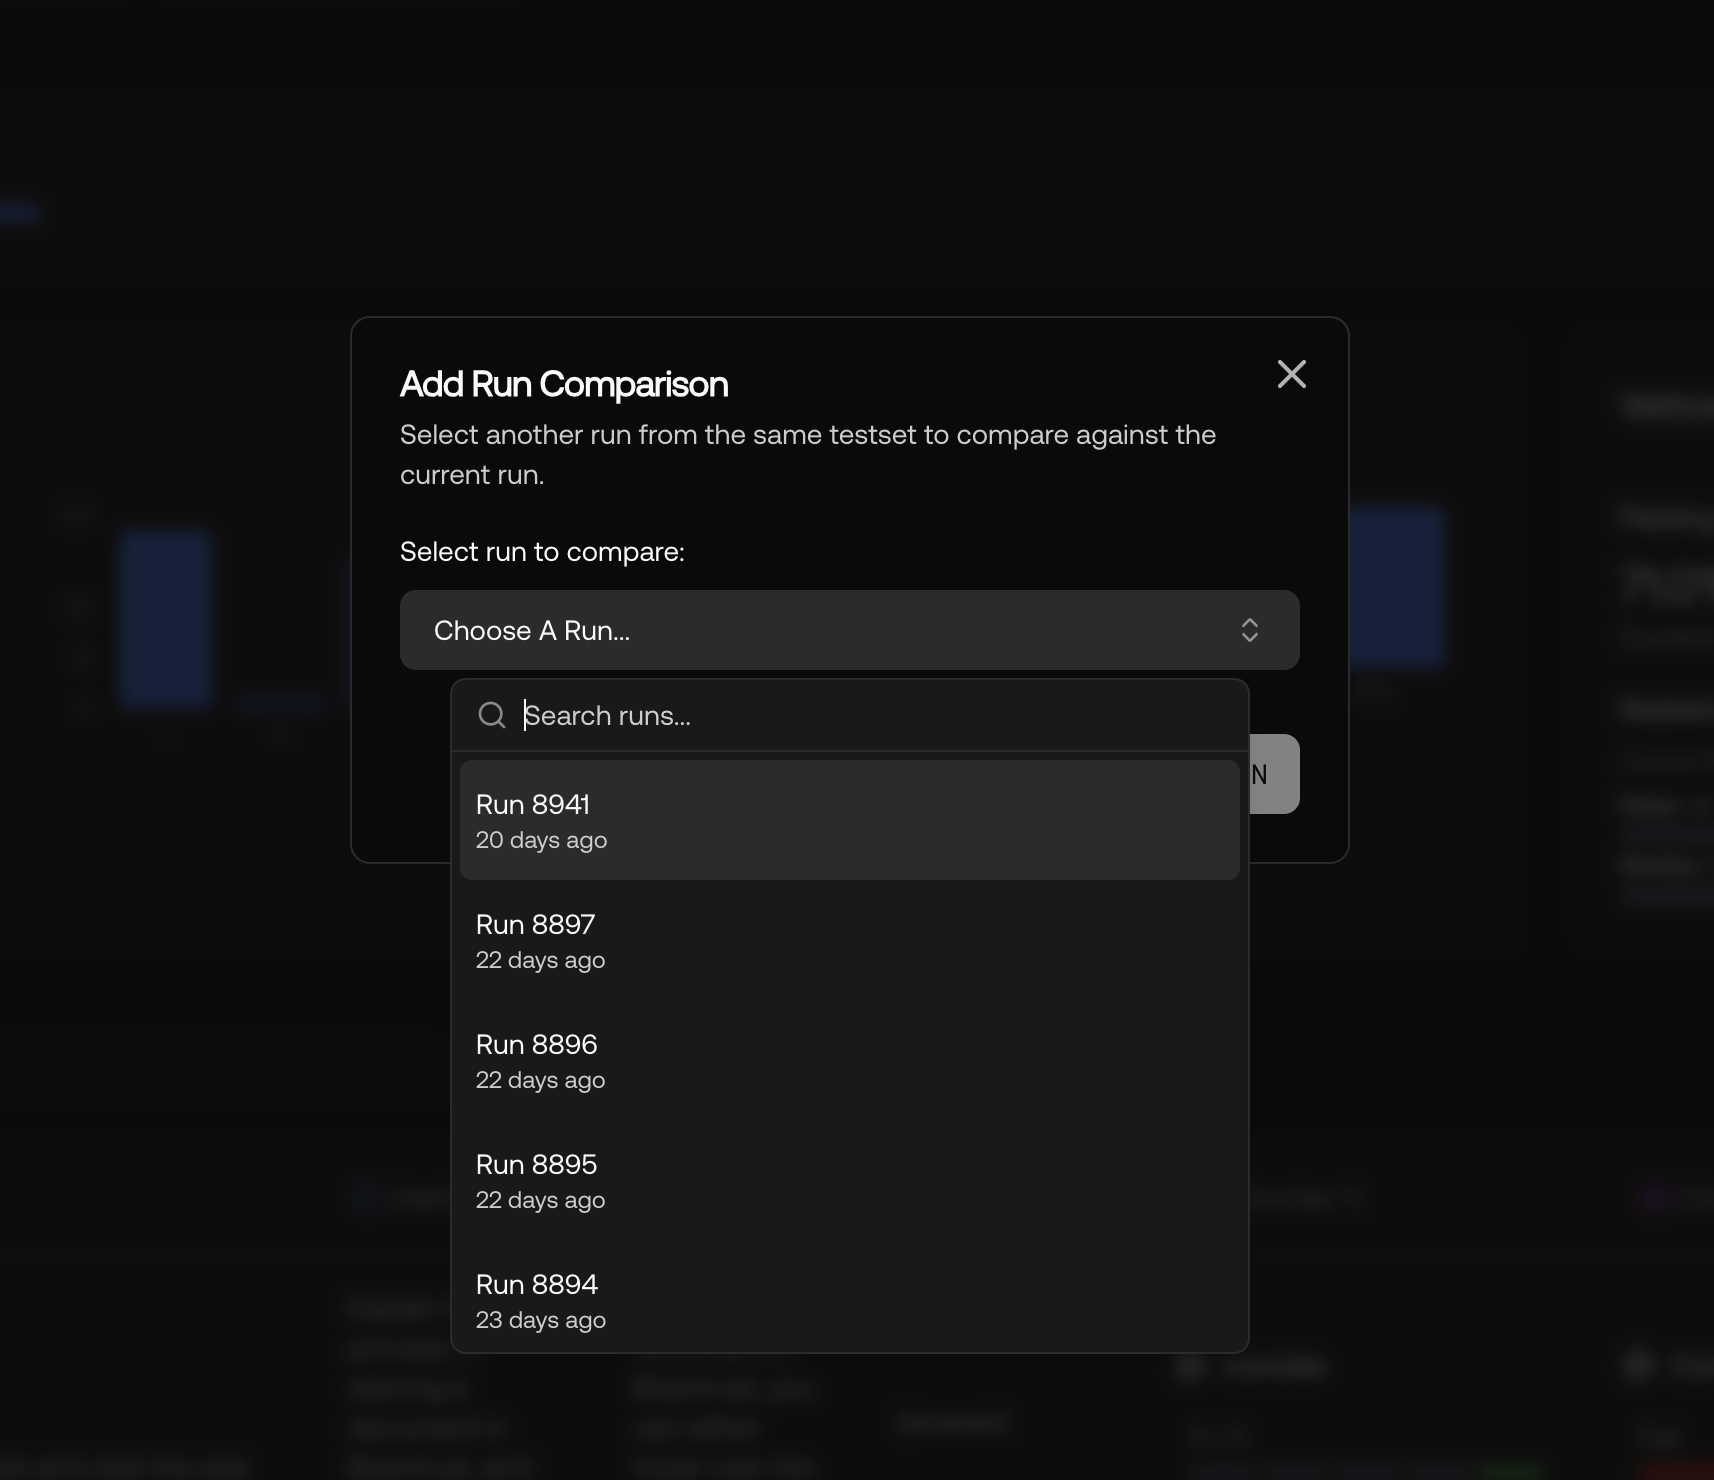
There are two ways to set up A/B comparisons in Scorecard:- From Run Details
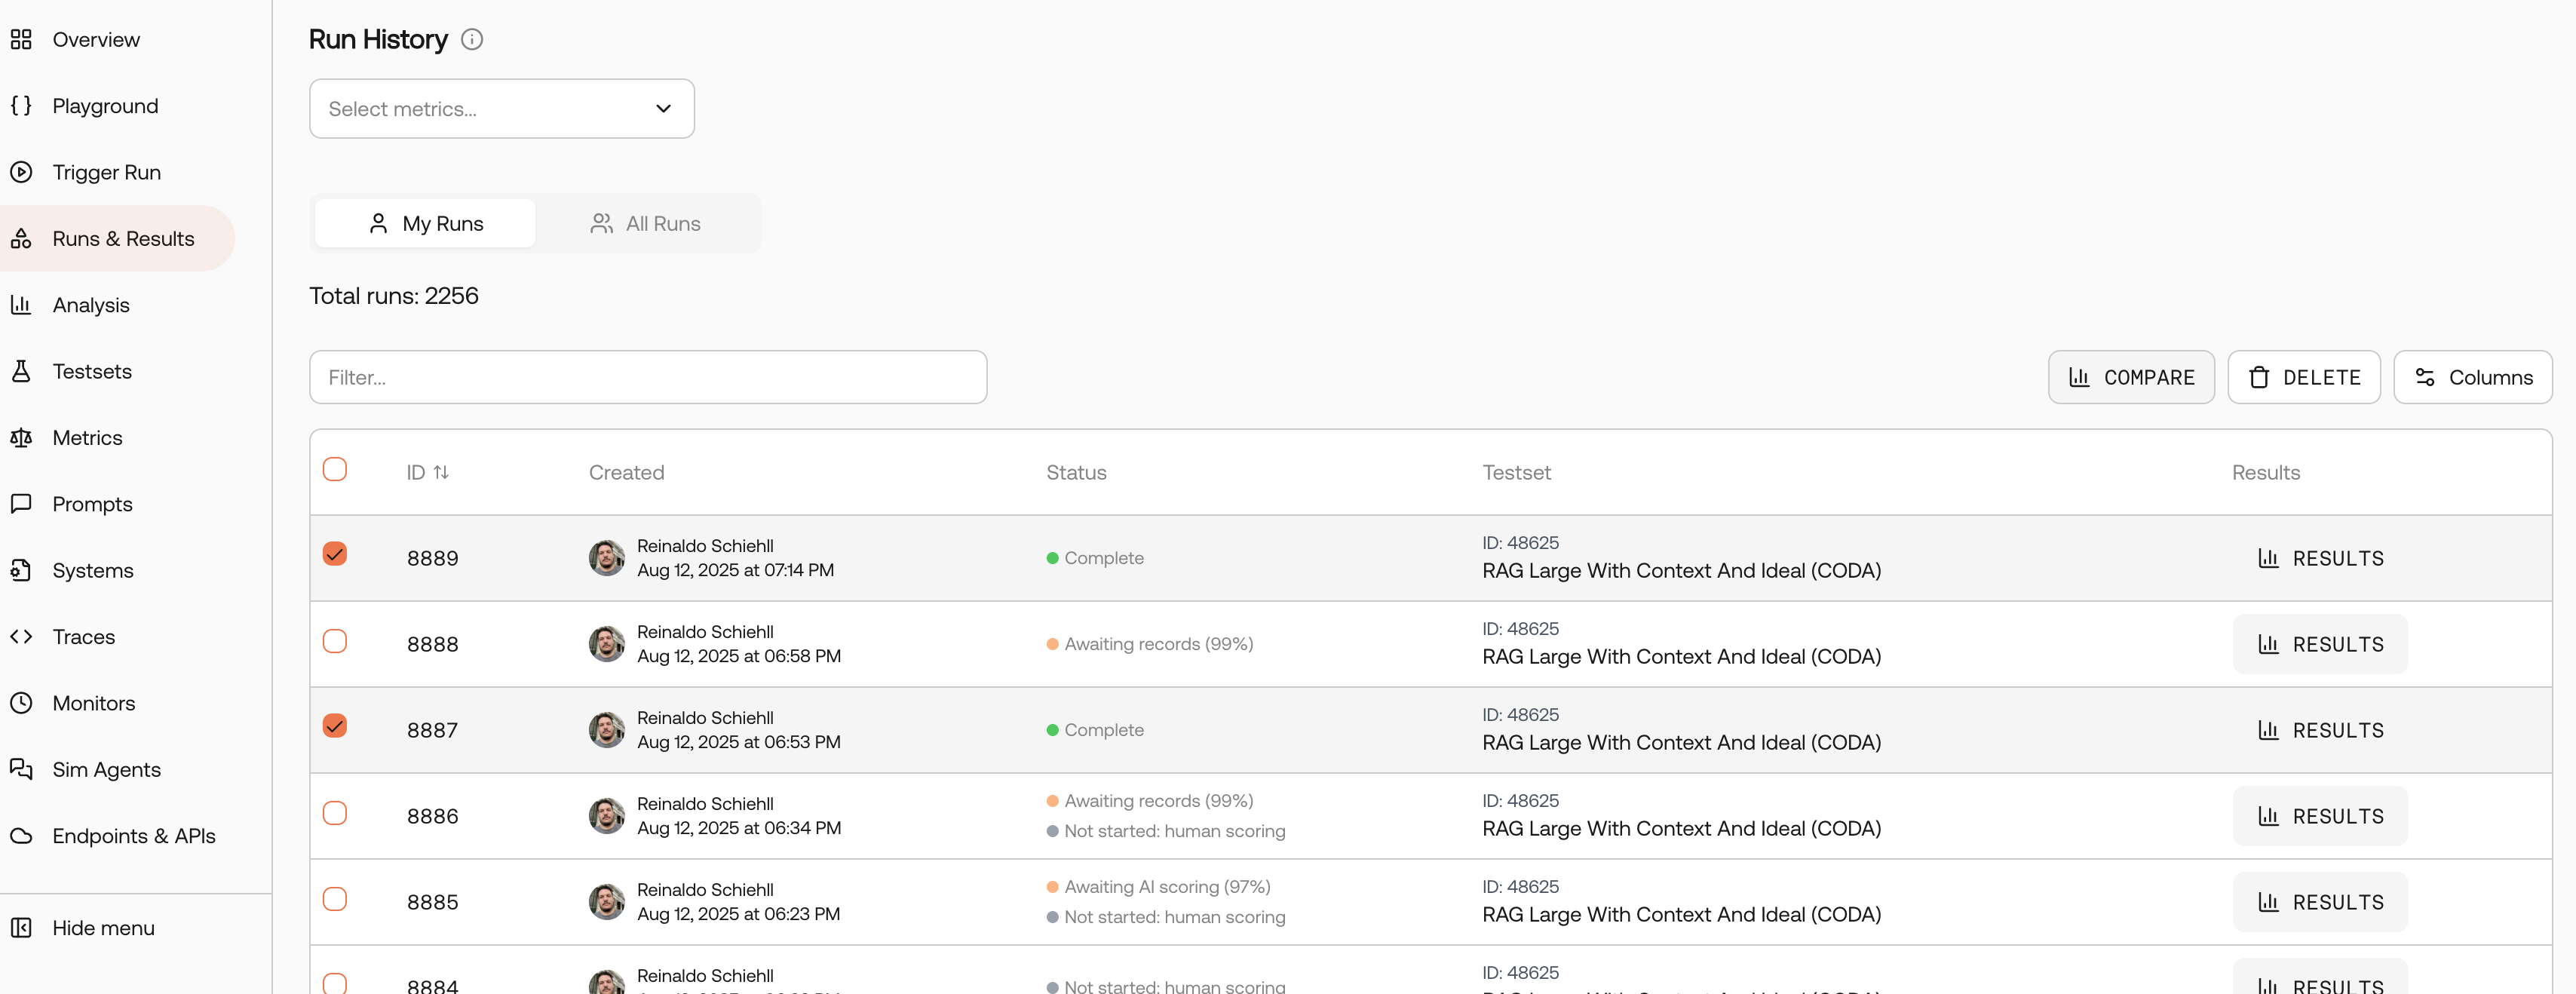
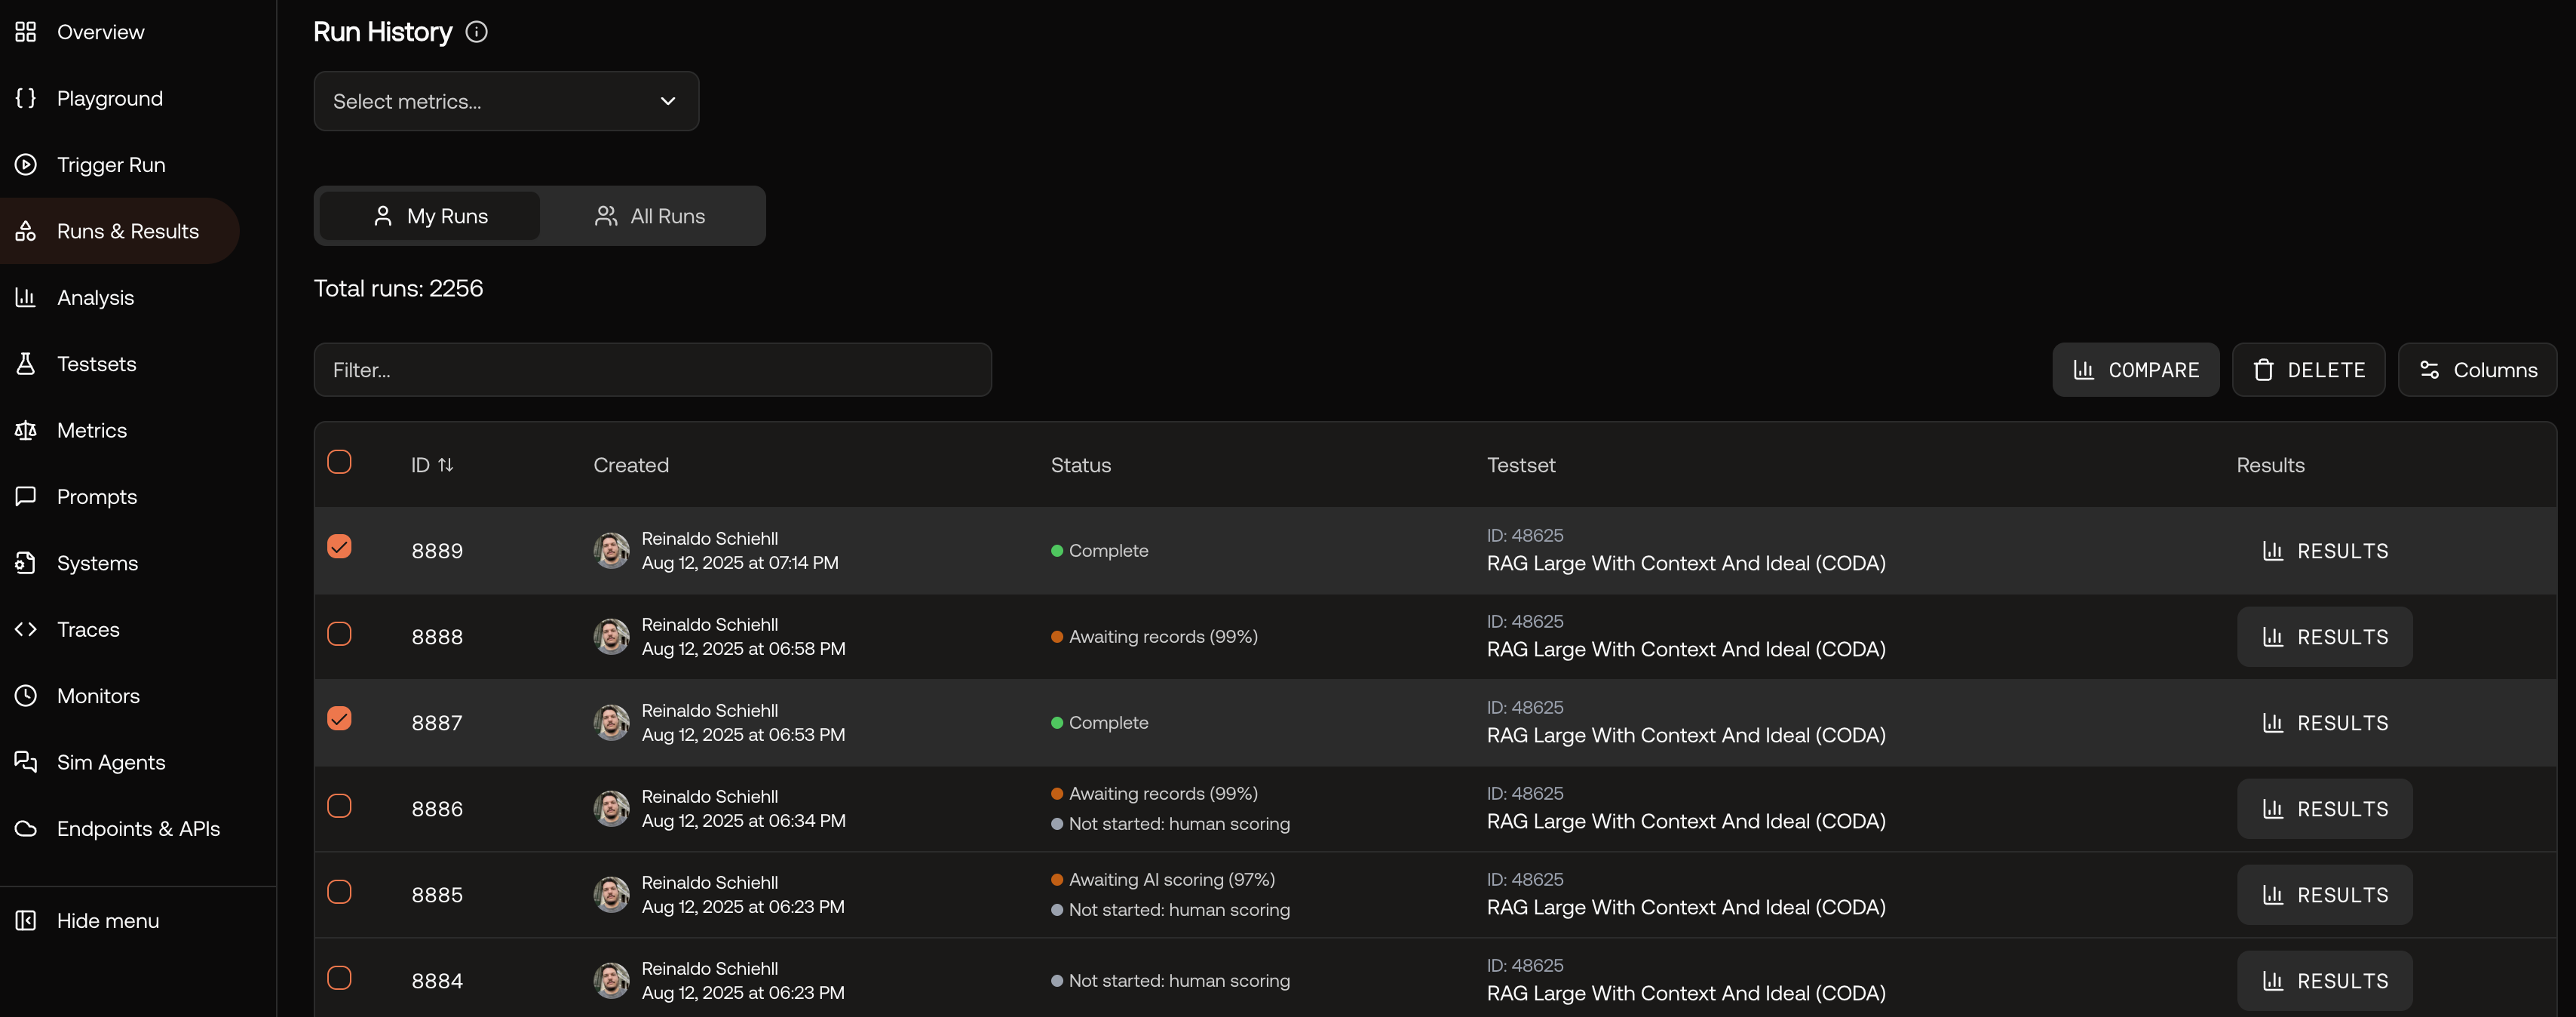
- From Runs List
Start a comparison directly from a specific run’s results page.
Navigate to Run Results
Go to the results page of the run you want to use as your baseline comparison.

Analyzing Comparison Results
Once you’ve set up your A/B comparison, Scorecard displays the results in an intuitive side-by-side format: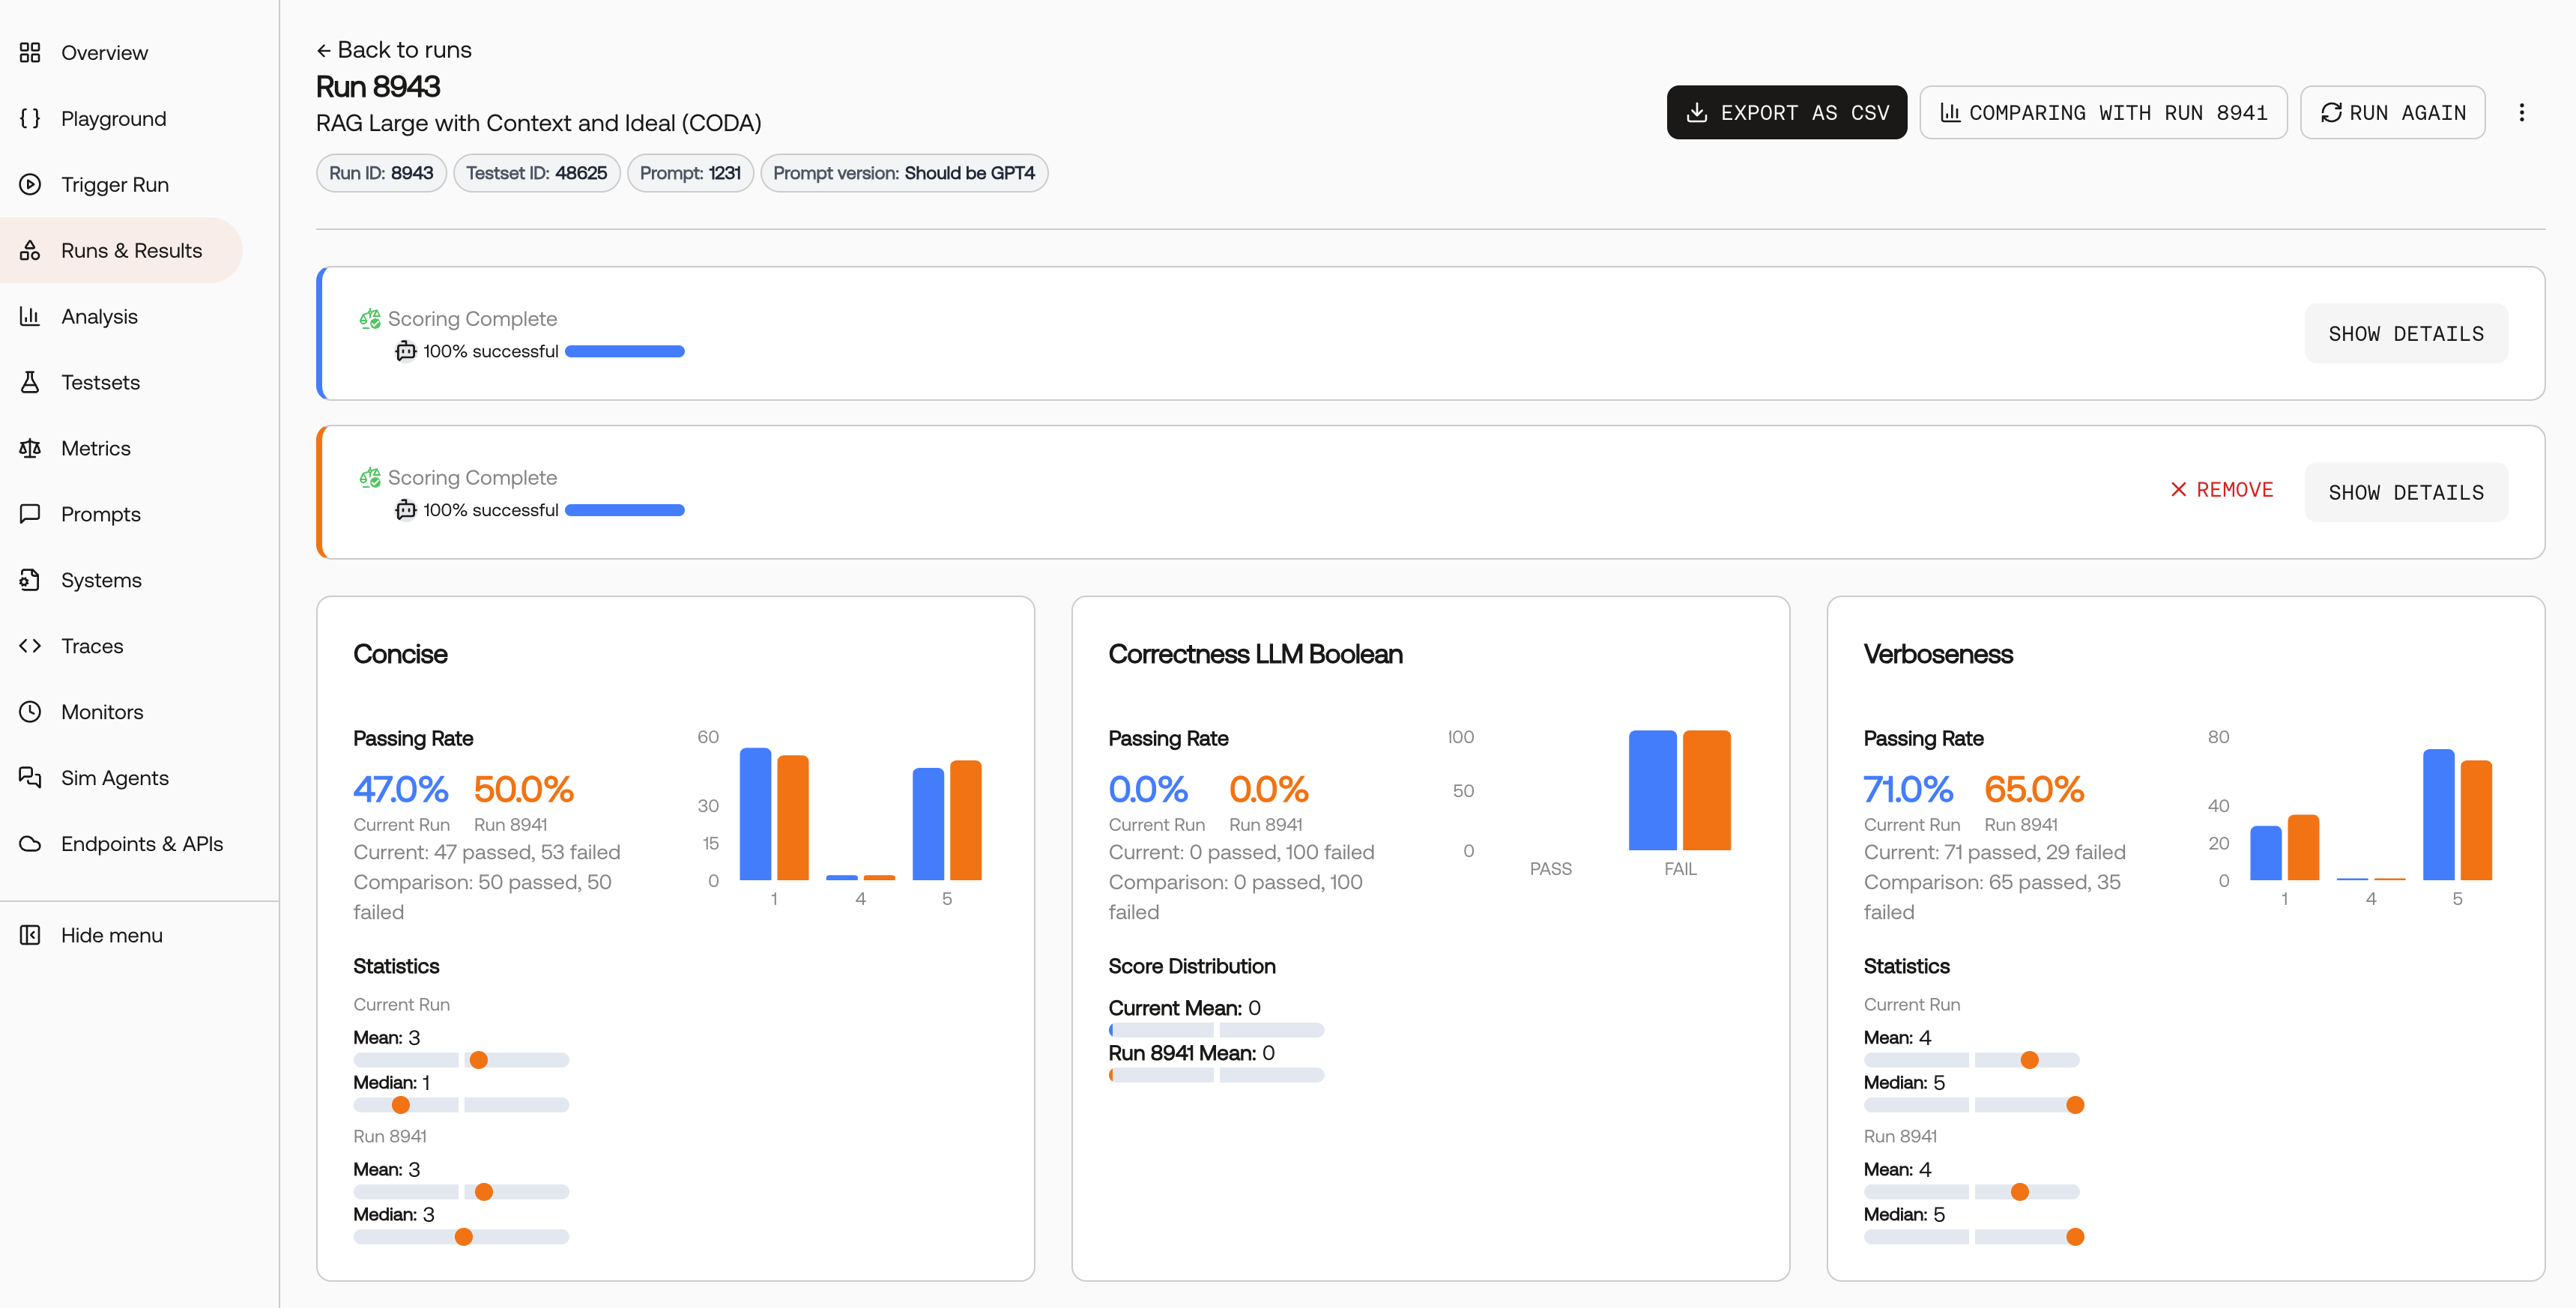
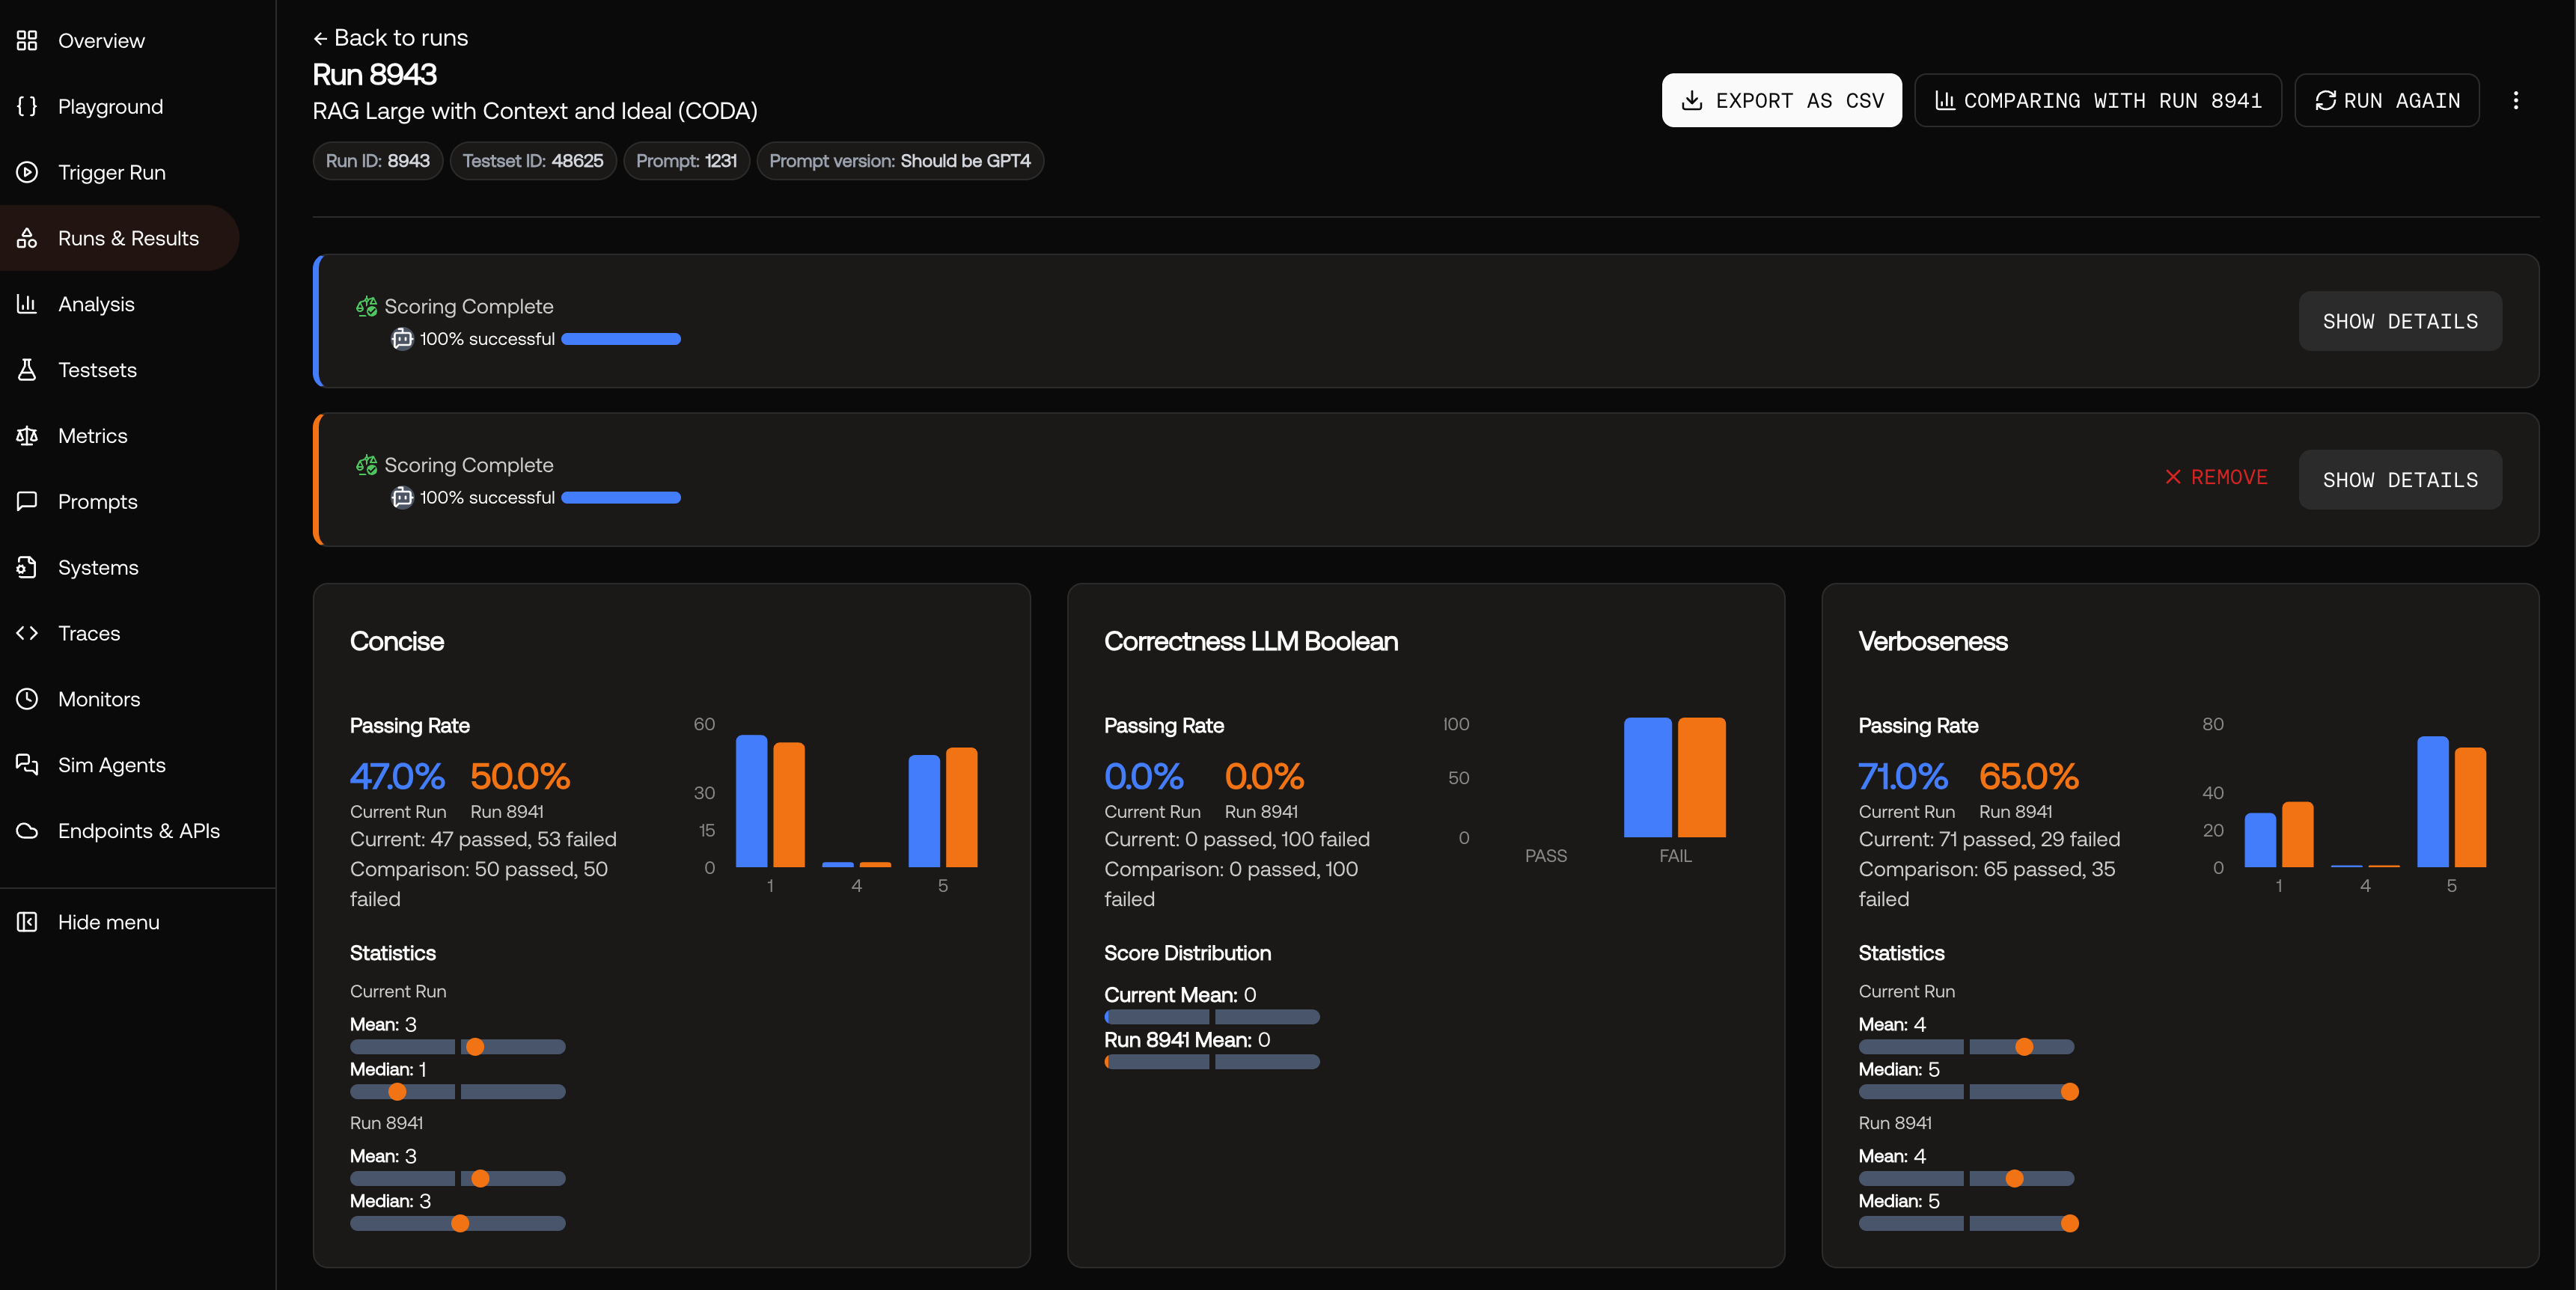
What You’ll See
- Aggregated Metrics: View performance scores for both runs across all your configured metrics
- Side-by-Side Charts: Visual representations make it easy to spot performance differences
- Statistical Significance: Understand whether observed differences are meaningful
- Detailed Breakdowns: Drill down into specific test cases to understand where improvements occurred
Best Practices
Use Comprehensive Metrics
Use Comprehensive Metrics
Include multiple metrics that cover different aspects of your system (accuracy, relevance, safety, etc.) to get a complete picture of performance changes.
Test with Sufficient Data
Test with Sufficient Data
Ensure your testset has enough examples to make statistically significant comparisons. Small testsets may lead to misleading conclusions.
Document Your Changes
Document Your Changes
Keep track of what specific changes you made between runs so you can understand which modifications led to improvements.