

Run details page.
What is a Run?
Every run consists of:- (Optional) Testset: Collection of test cases to evaluate against
- (Optional) Metrics: Evaluation criteria that score system outputs
- (Optional) System Version: Configuration defining your AI system’s behavior
- Records: Individual test executions, one per Testcase
- Scores: Evaluation results for each record against each metric


List of recent runs with statuses.
Filtering Runs
You can filter runs by their source to quickly find runs created from specific workflows:- API: Runs created programmatically via the SDK or API
- Monitor: Runs created automatically by production monitors
- Playground: Runs kicked off from the Playground
- Kickoff: Runs created via the Kickoff Run modal in the UI
Creating Runs
Kickoff Run from the UI
You can kickoff a run from the Projects dashboard, Testsets list, or a Run (“Run again” button). The Kickoff Run modal lets you choose the Testset, Prompt, and Metrics for the run. The Scorecard tab lets you run using an LLM on Scorecard’s servers, so you can specify the LLM parameters. The GitHub tab lets you trigger a run using GitHub Actions on your actual system.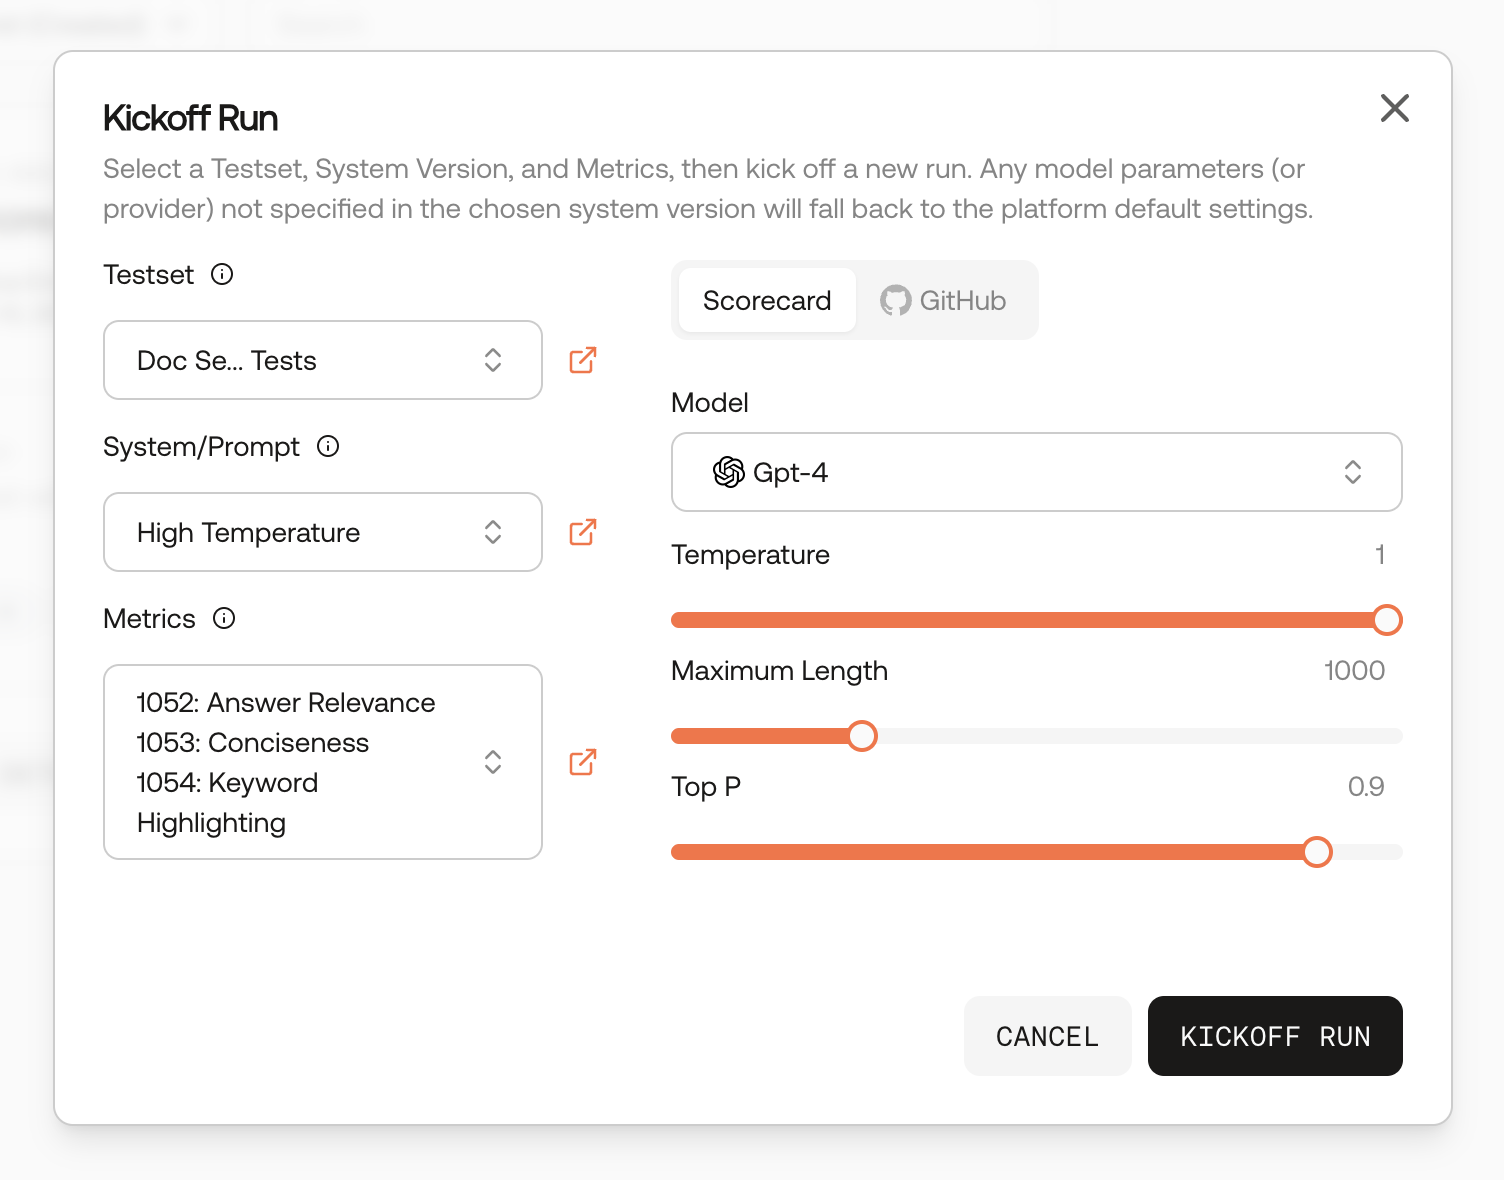
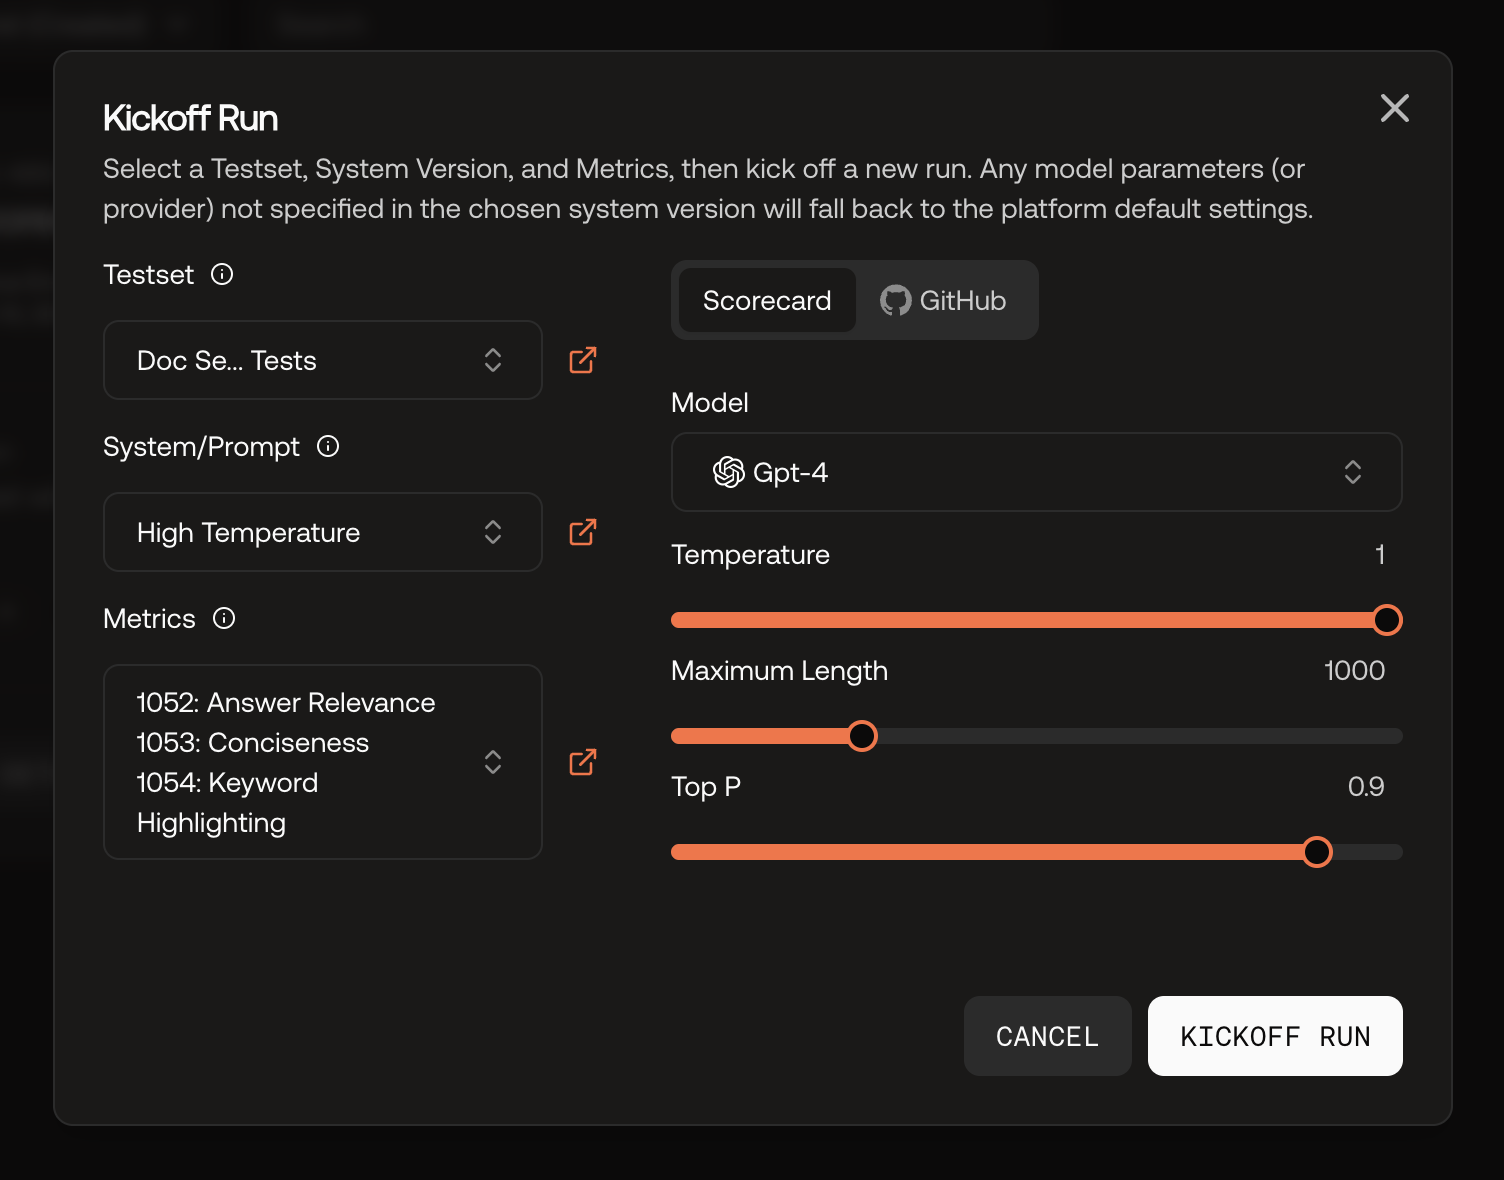
Kickoff Run modal.
From the Playground
The Playground allows you to test prompts interactively. Click Kickoff Run to create a run with a specified testset, prompt version, and metrics.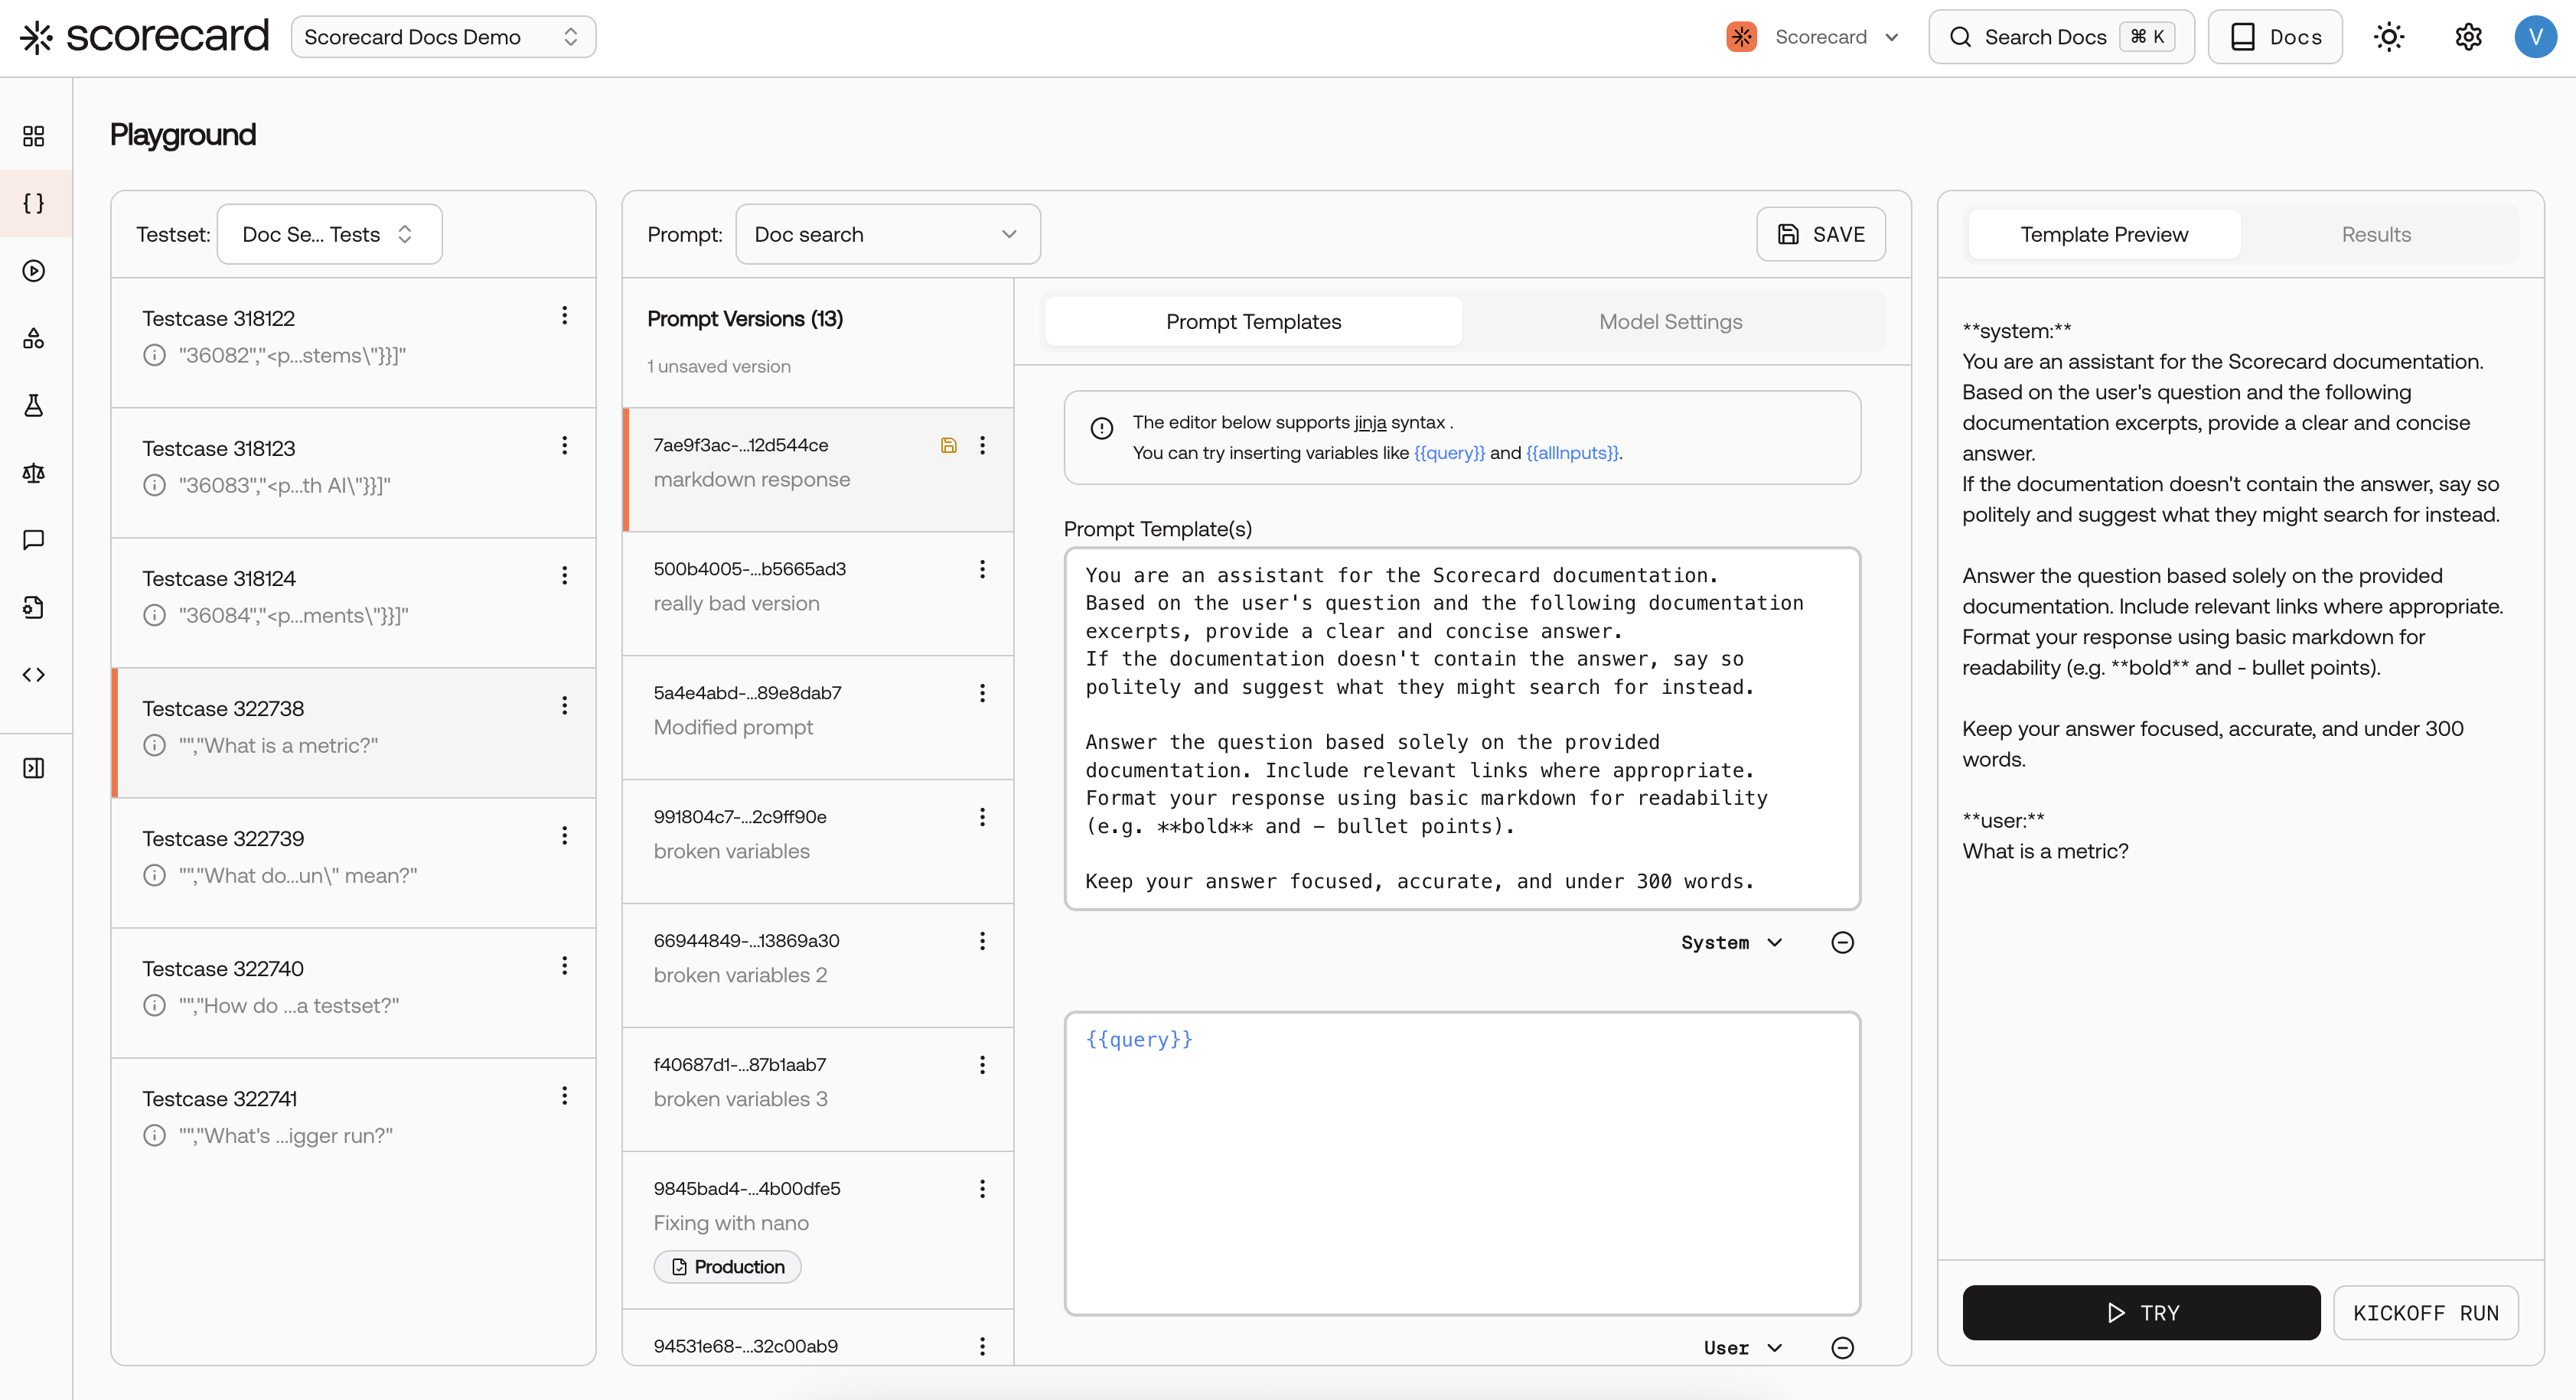
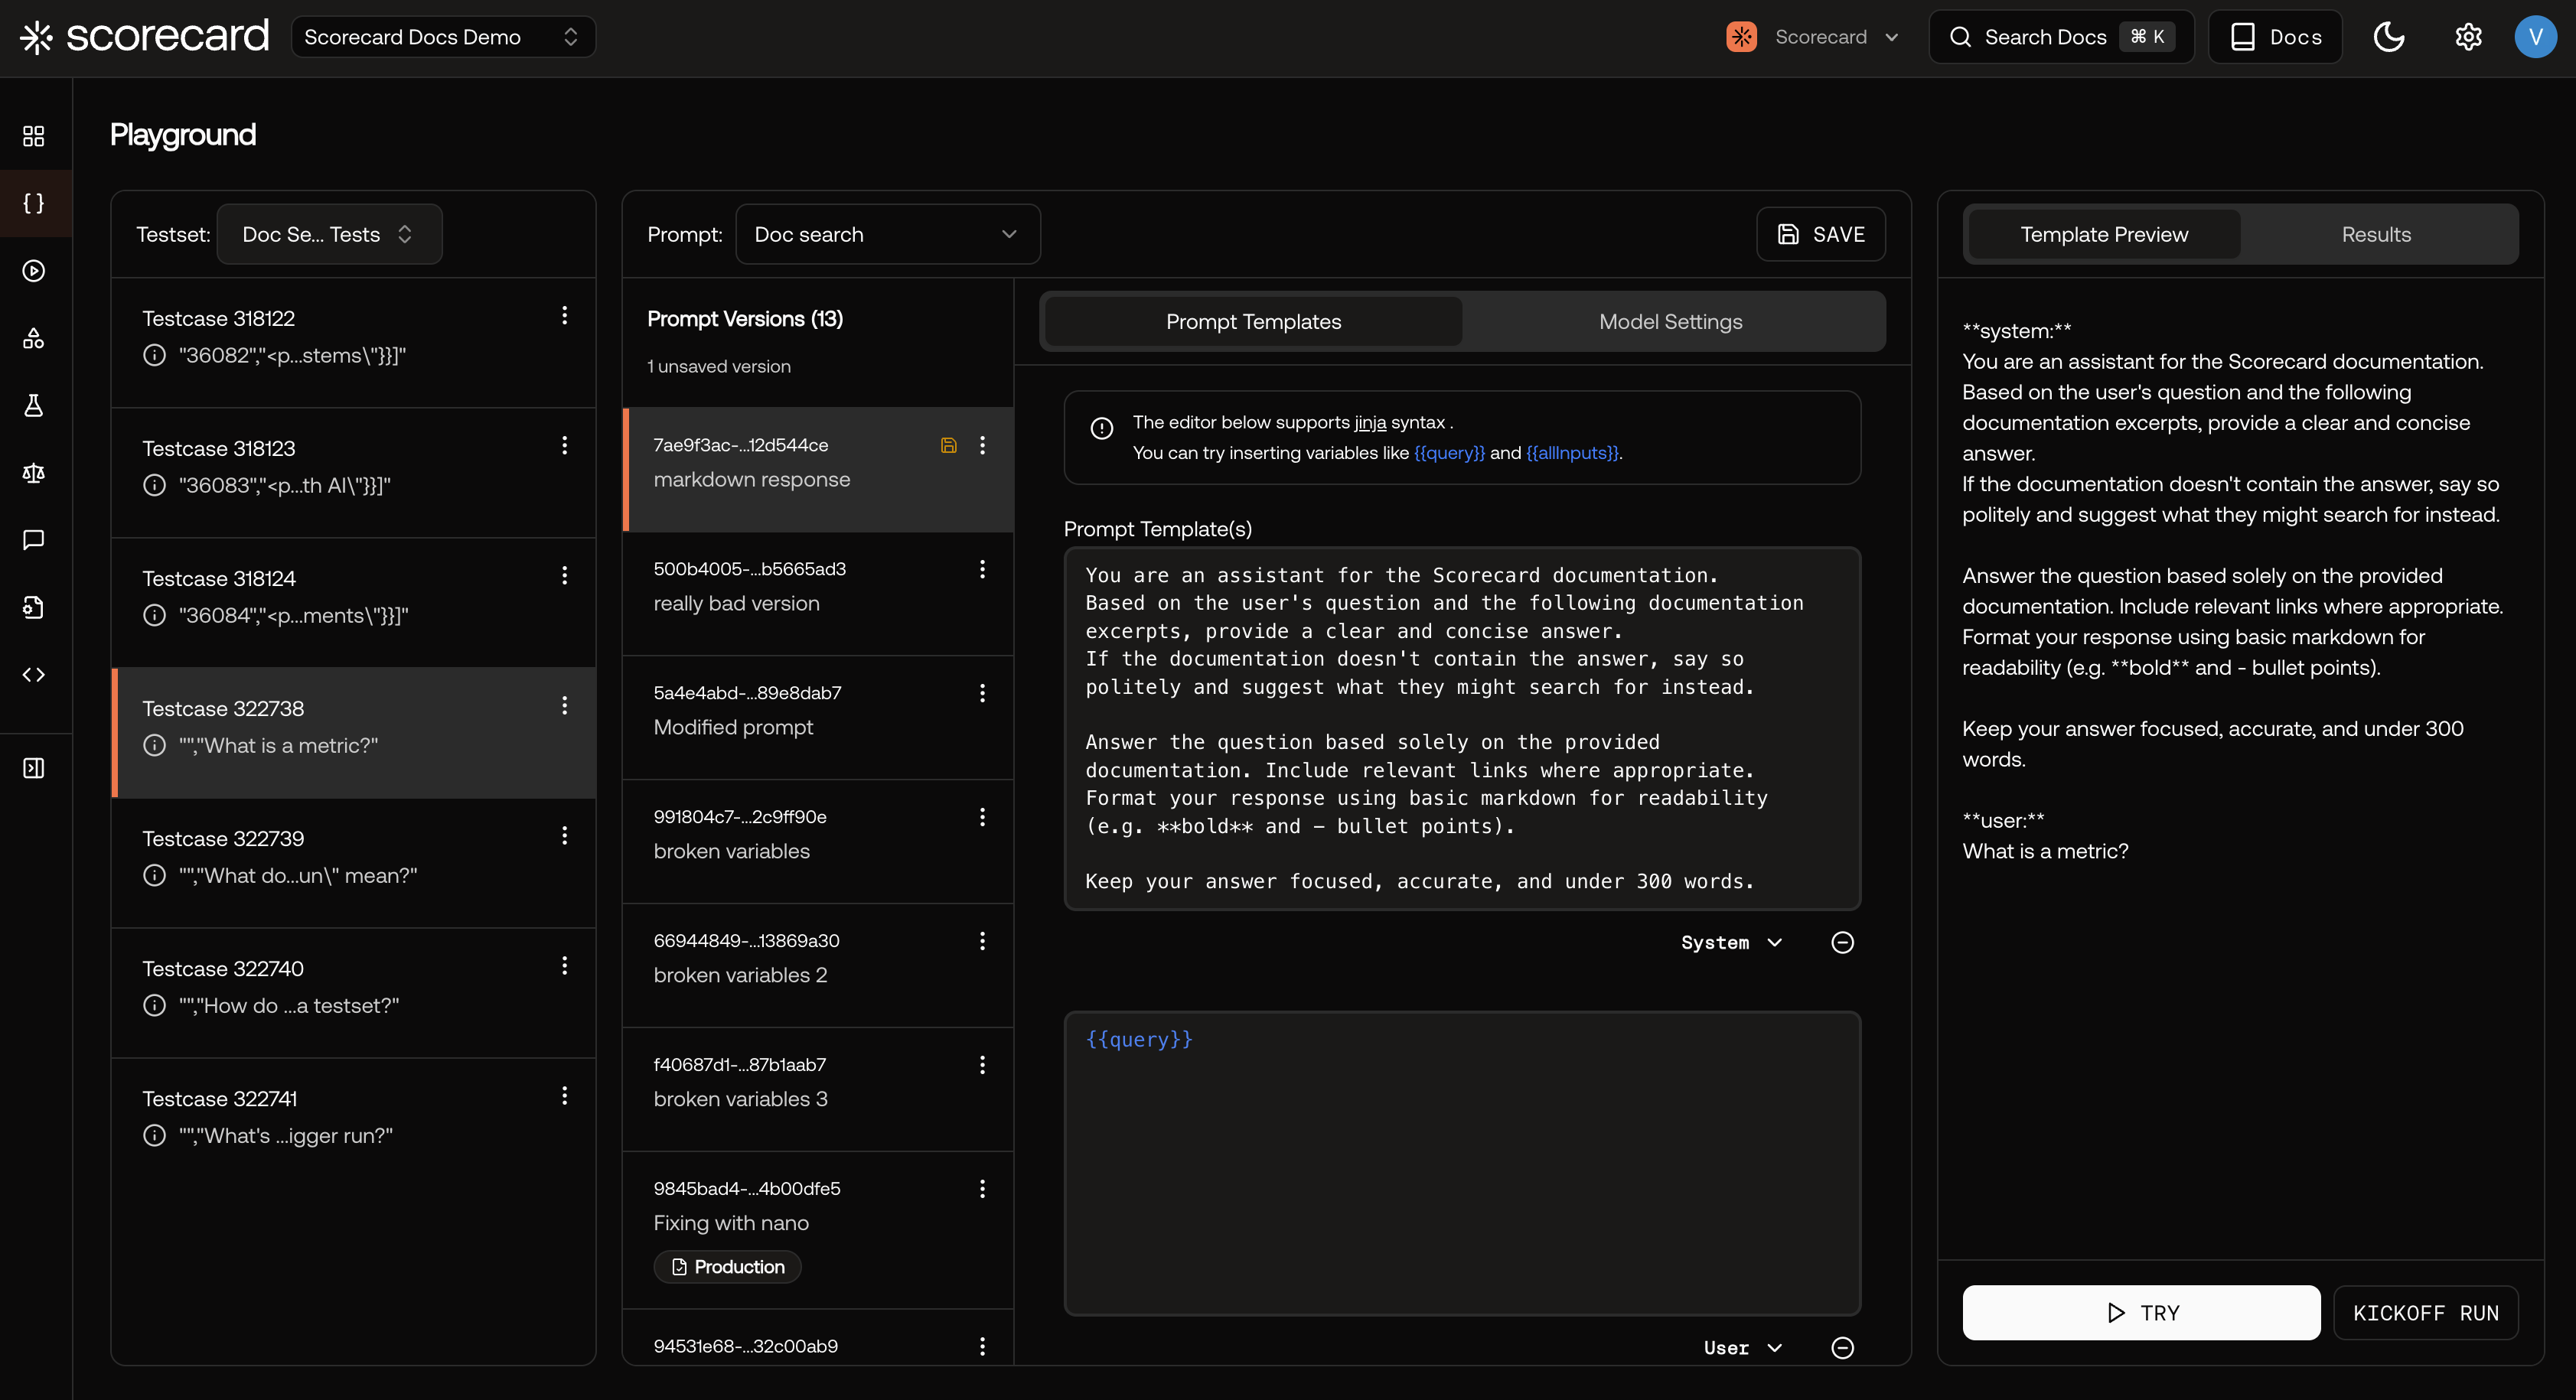
Playground overview.
Using the API
You can create runs and records programmatically using the Scorecard SDK.Via GitHub Actions
Using Scorecard’s GitHub integration, you can trigger runs automatically (e.g. on pull request or a schedule). With the integration set up, you can also trigger runs of your real system from the Scorecard UI.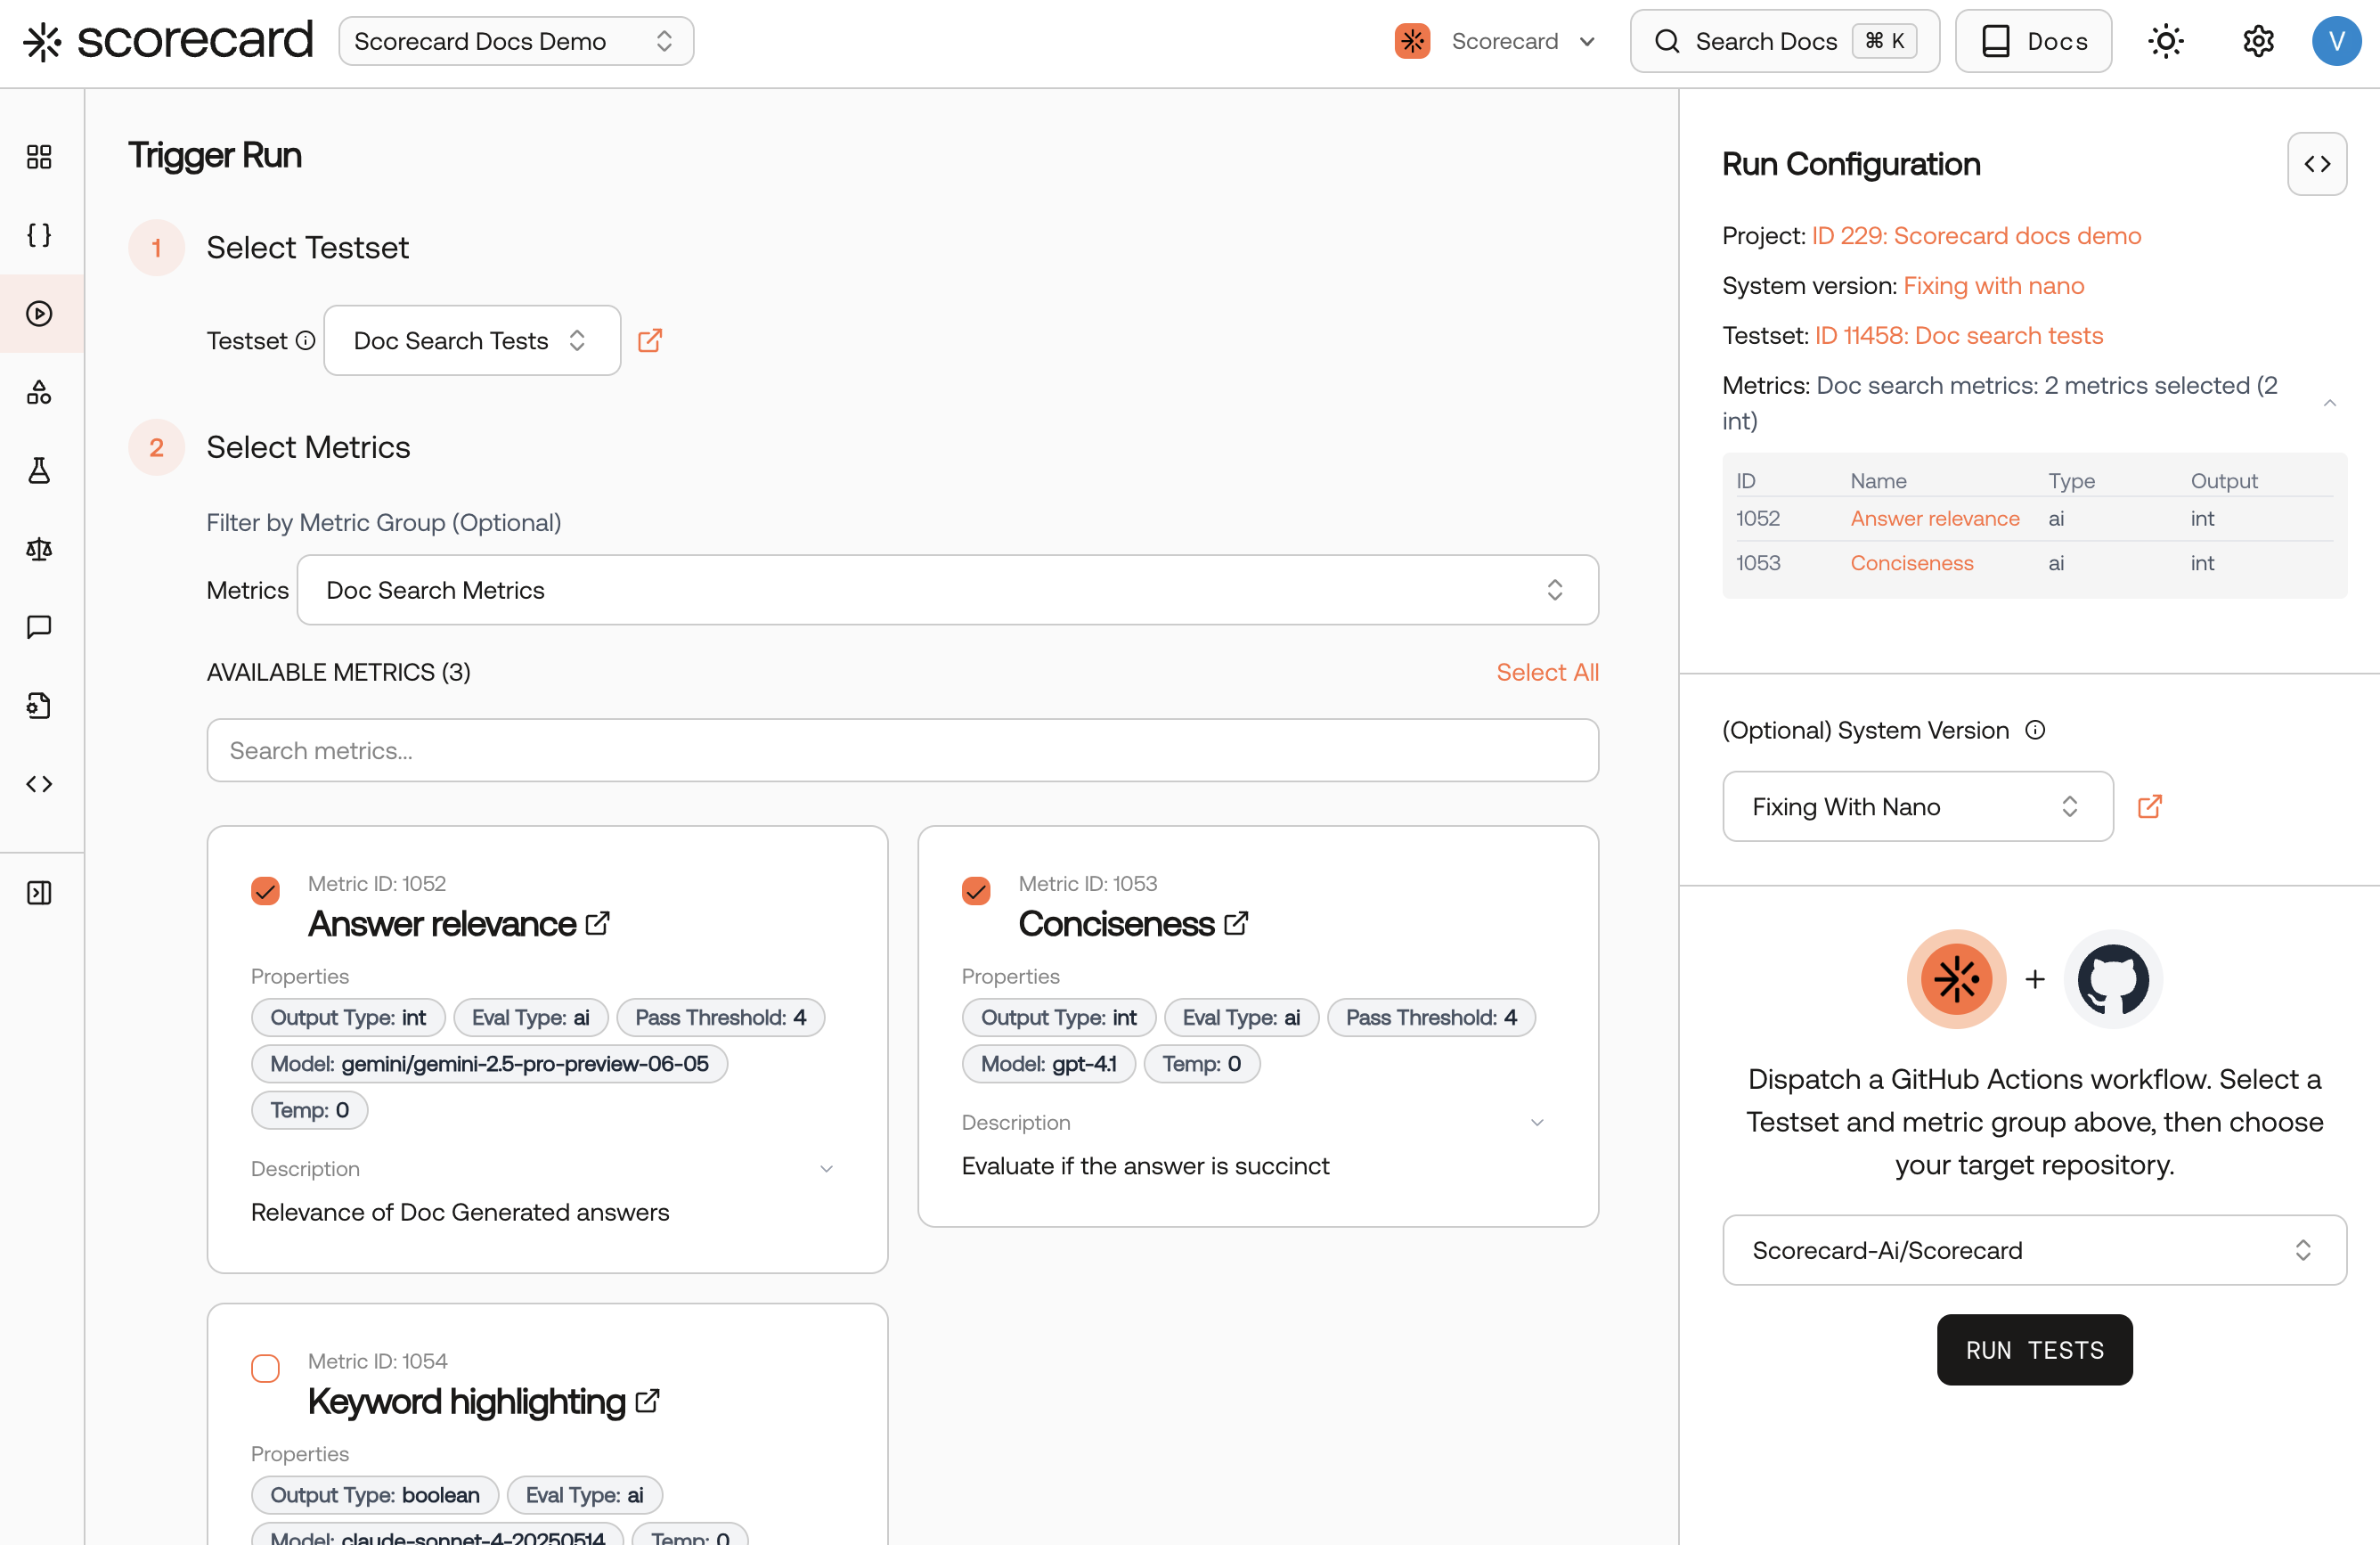
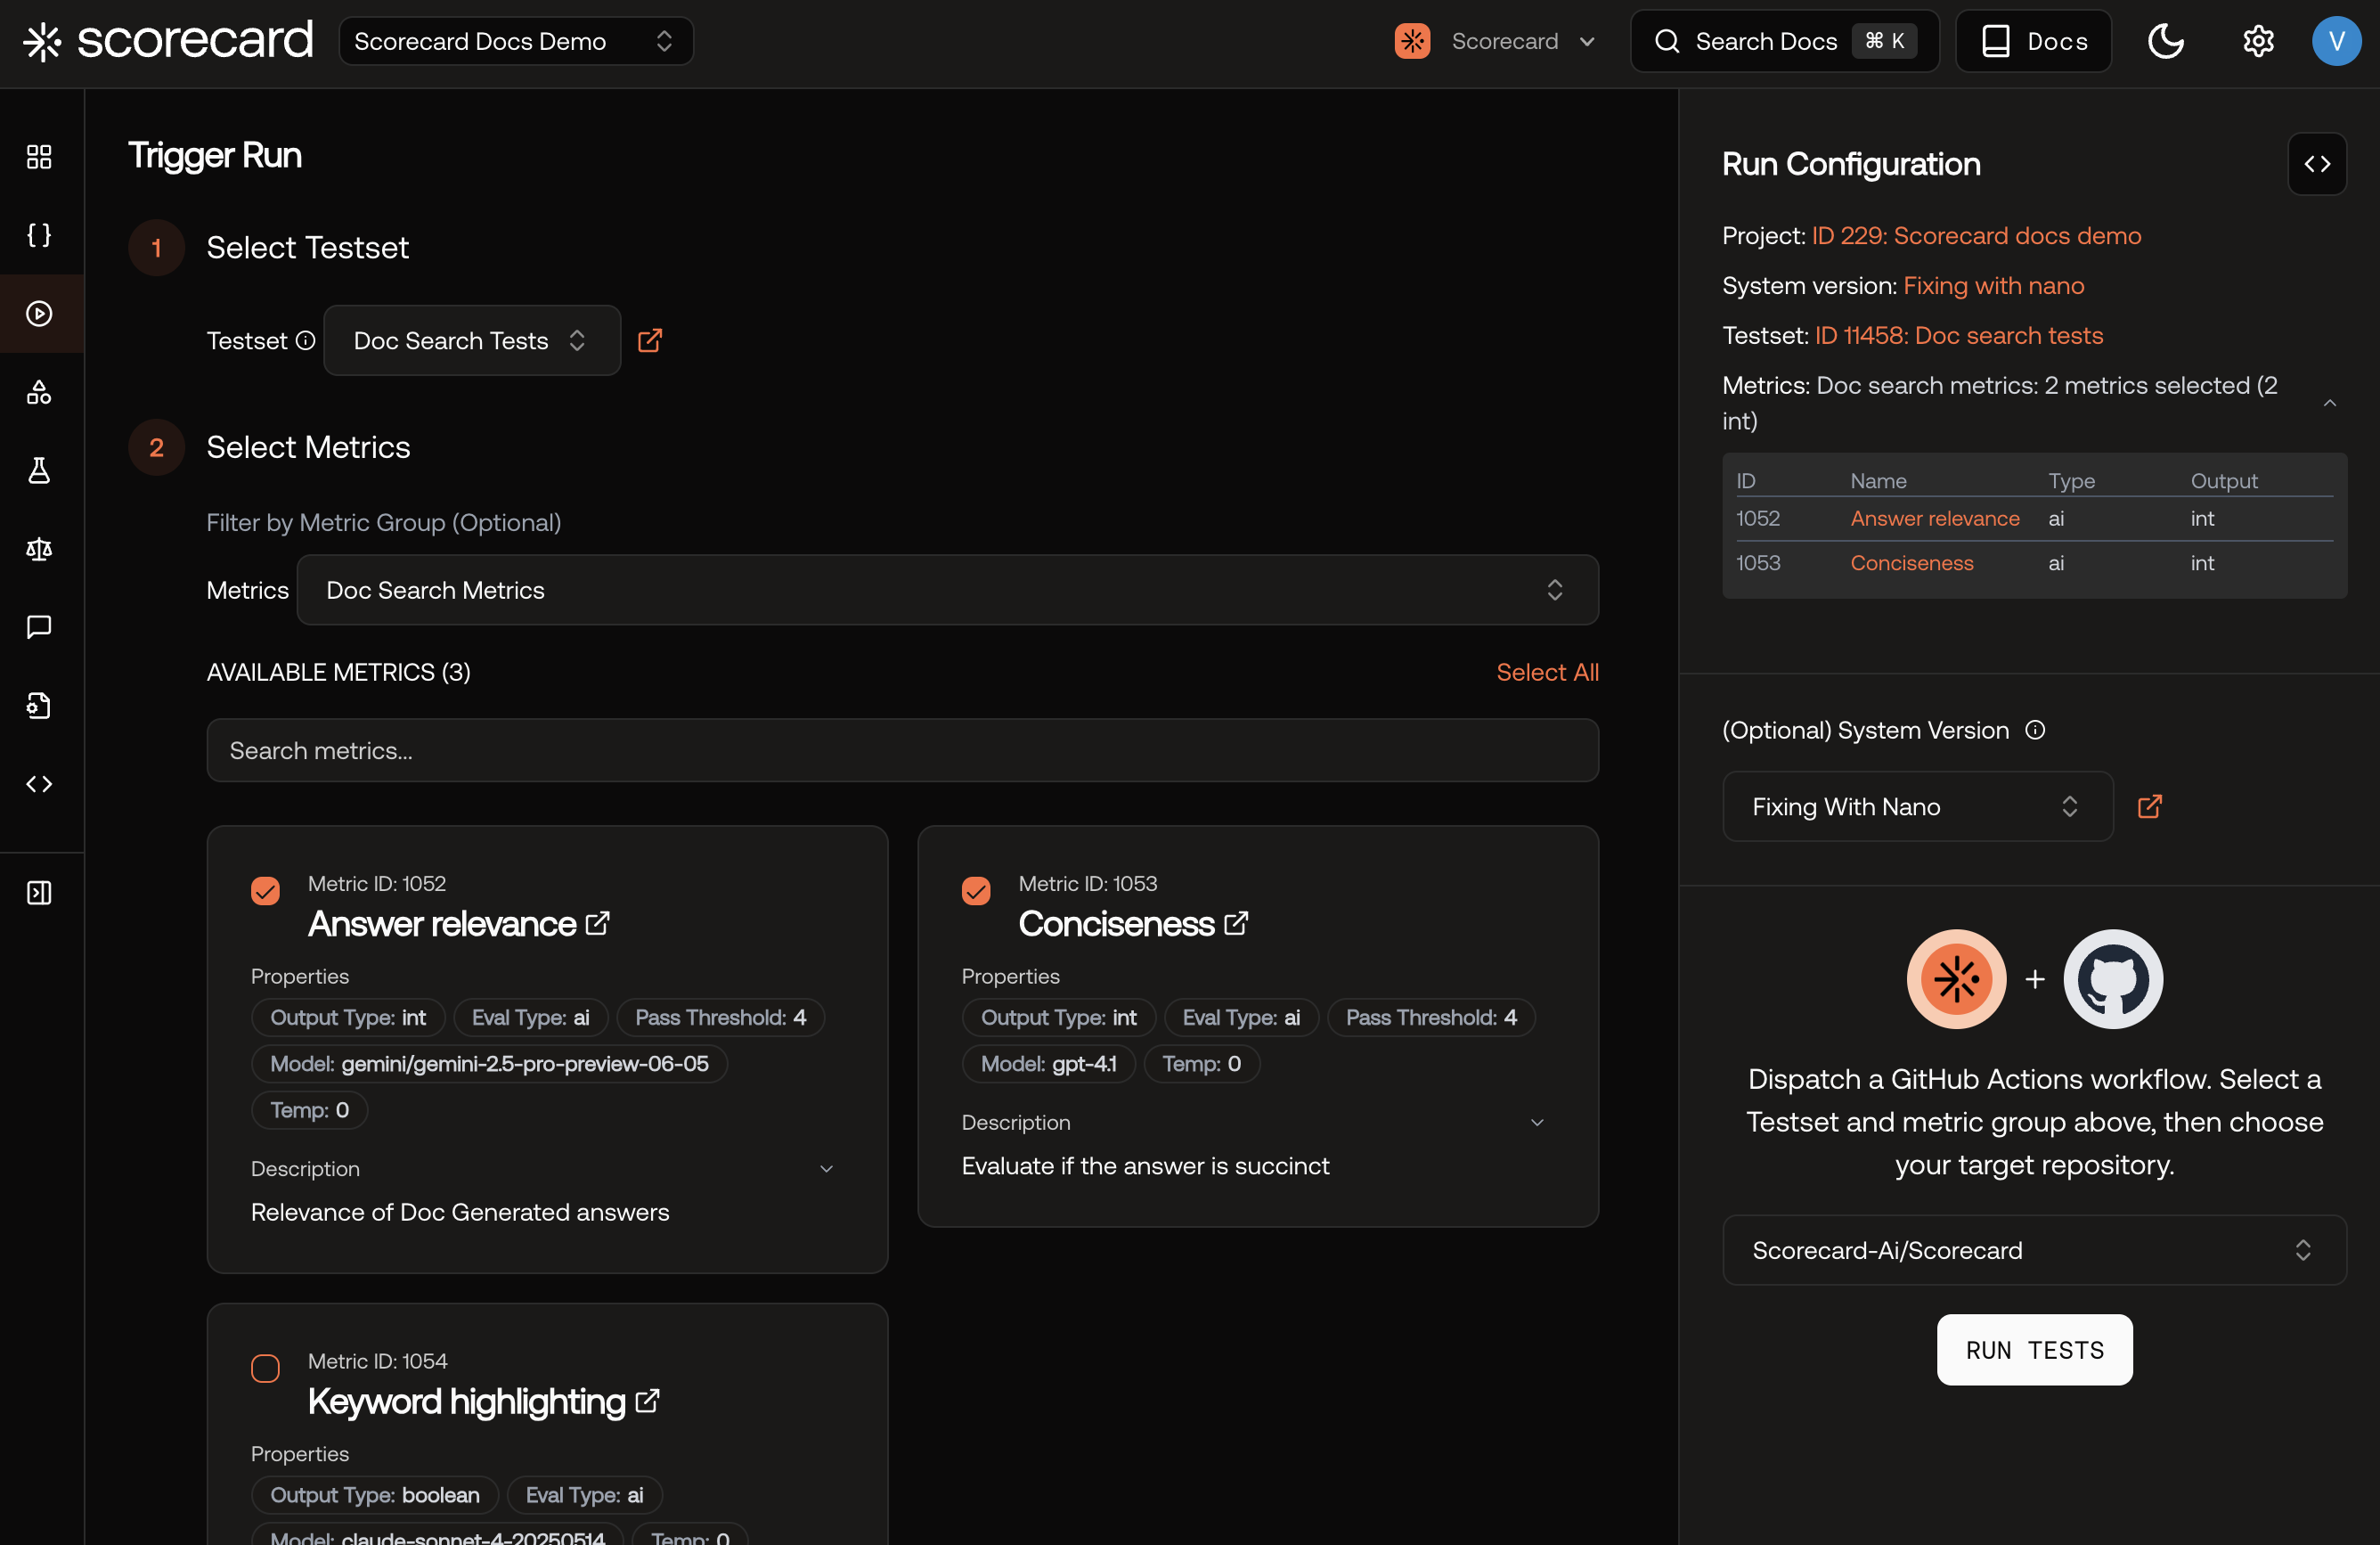
Triggering a run through the Scorecard GitHub integration.
Run Status
If you click on the run status of a run, it will expands to show an explanation of the scoring status for each of the metrics in the run.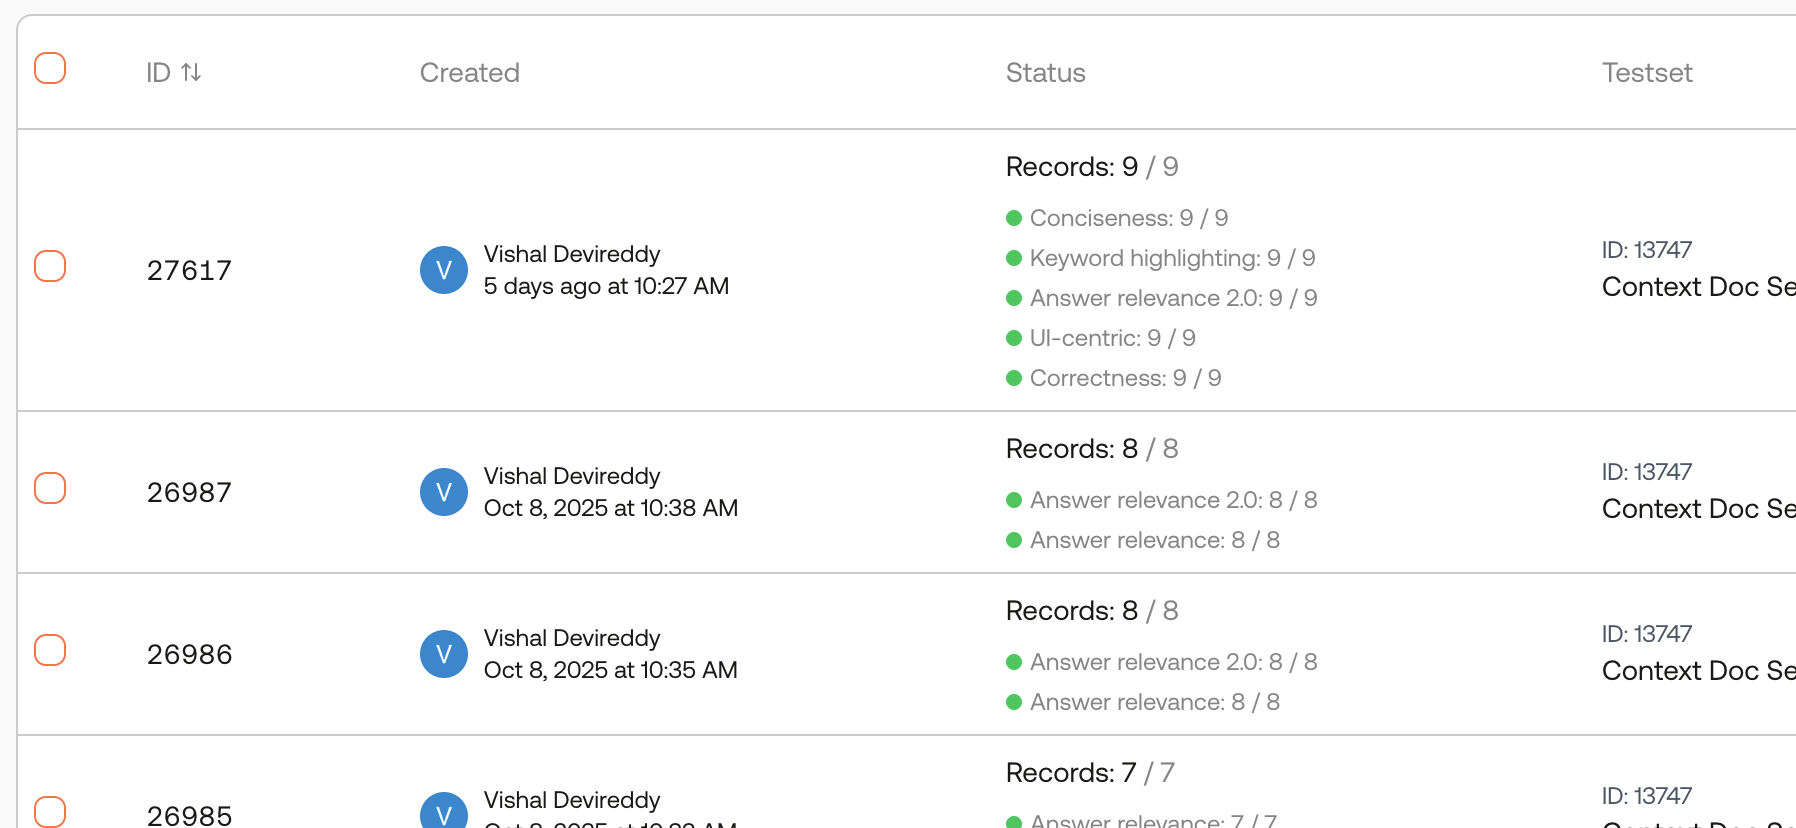
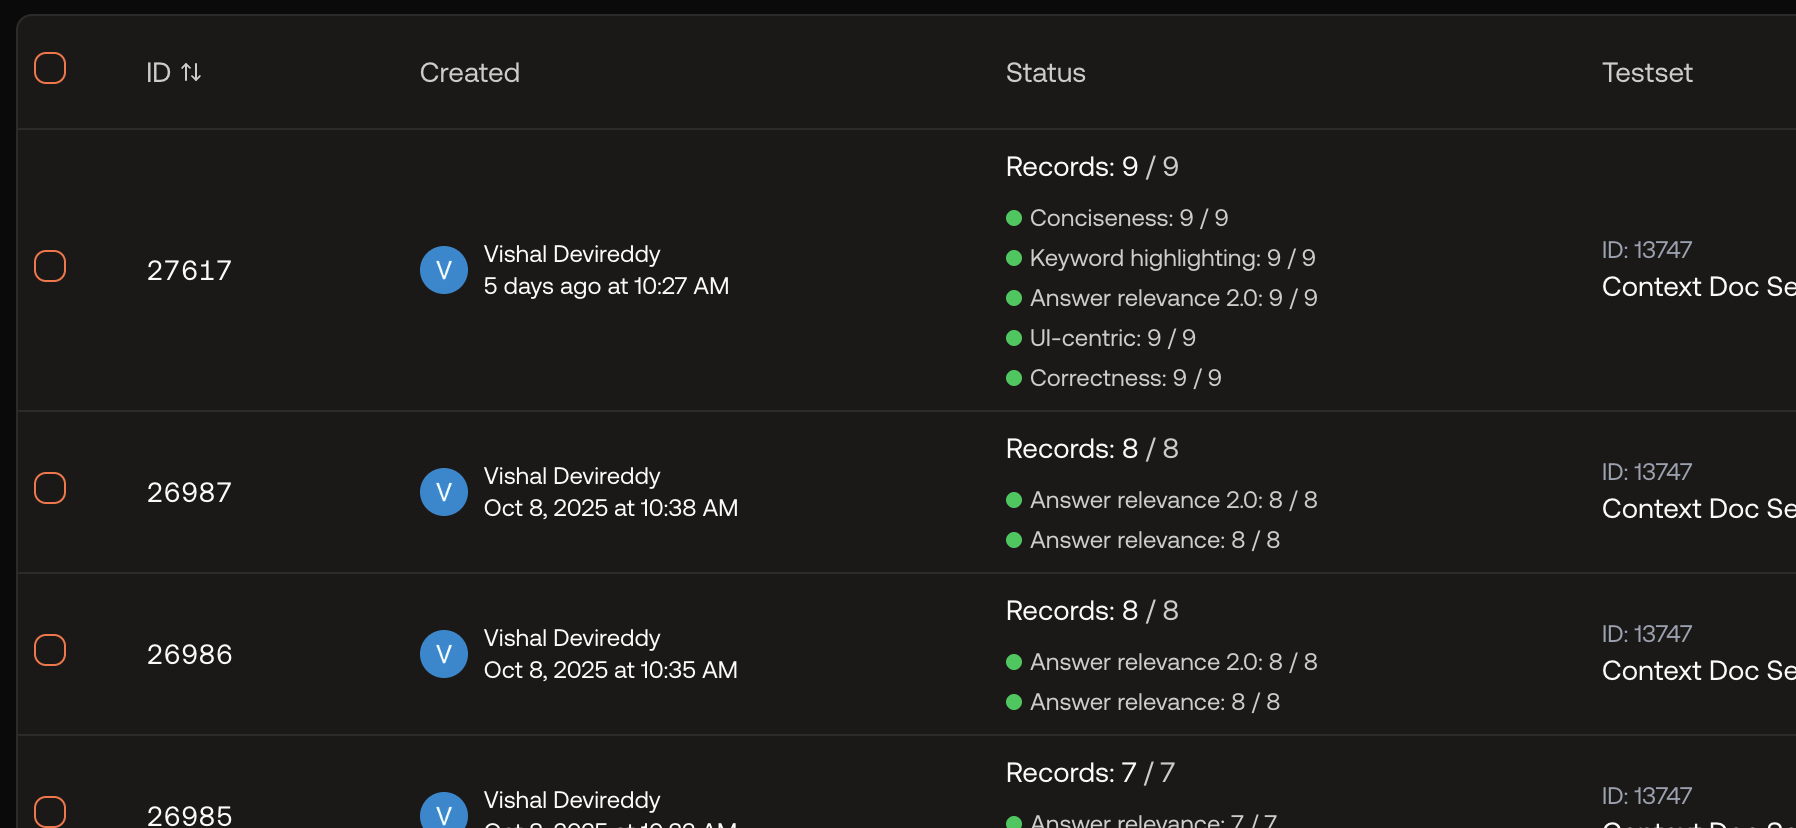
Run status explanation.
Re-run Scoring
You can re-run scoring on existing runs without re-executing your system. This is useful when:- You’ve updated a metric’s guidelines and want to see how it affects existing results
- You want to add new metrics to a completed run
- You need to re-evaluate after fixing a metric configuration issue
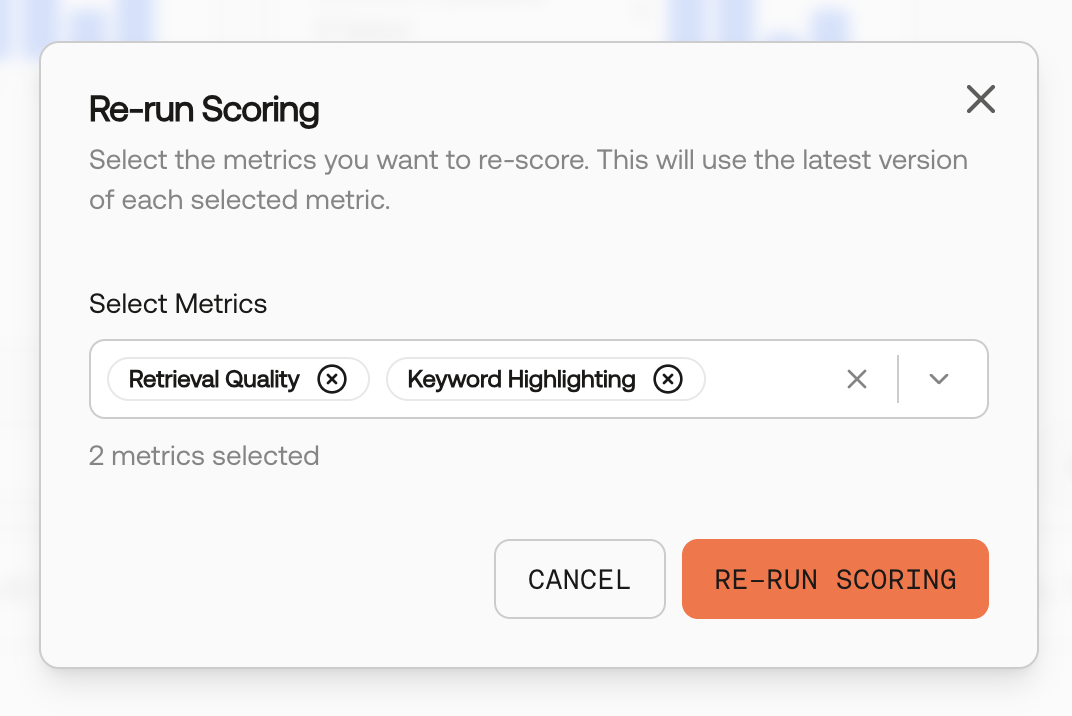
Re-run scoring modal for an existing run.
Inspect a Record


Record score explanation.
- Inputs: Original Testcase data sent to your system
- Outputs: Generated responses from your AI system
- Expected Outputs: Ideal responses for comparison
- Scores: Detailed evaluation results from each metric
Records Page
The Records page provides a project-level view of all test records across your runs. Use it to search, filter, and analyze records without navigating through individual runs.Export a Run
Click the Export as CSV button on the run details page.Run Notes
Click Show Details on a run page to view or edit the run notes and view the system/prompt version the run was executed with.

Run details with notes and system configuration.
Run data includes potentially sensitive information from your Testsets and system outputs. Follow your organization’s data handling policies and avoid including PII or confidential data in test configurations.
Run History
View your AI system’s performance trends over time with interactive charts for each metric on the run list page. Run history helps you identify performance trends, compare metrics side-by-side, and track consistency across runs.

Run history charts showing three metrics' performance over time.