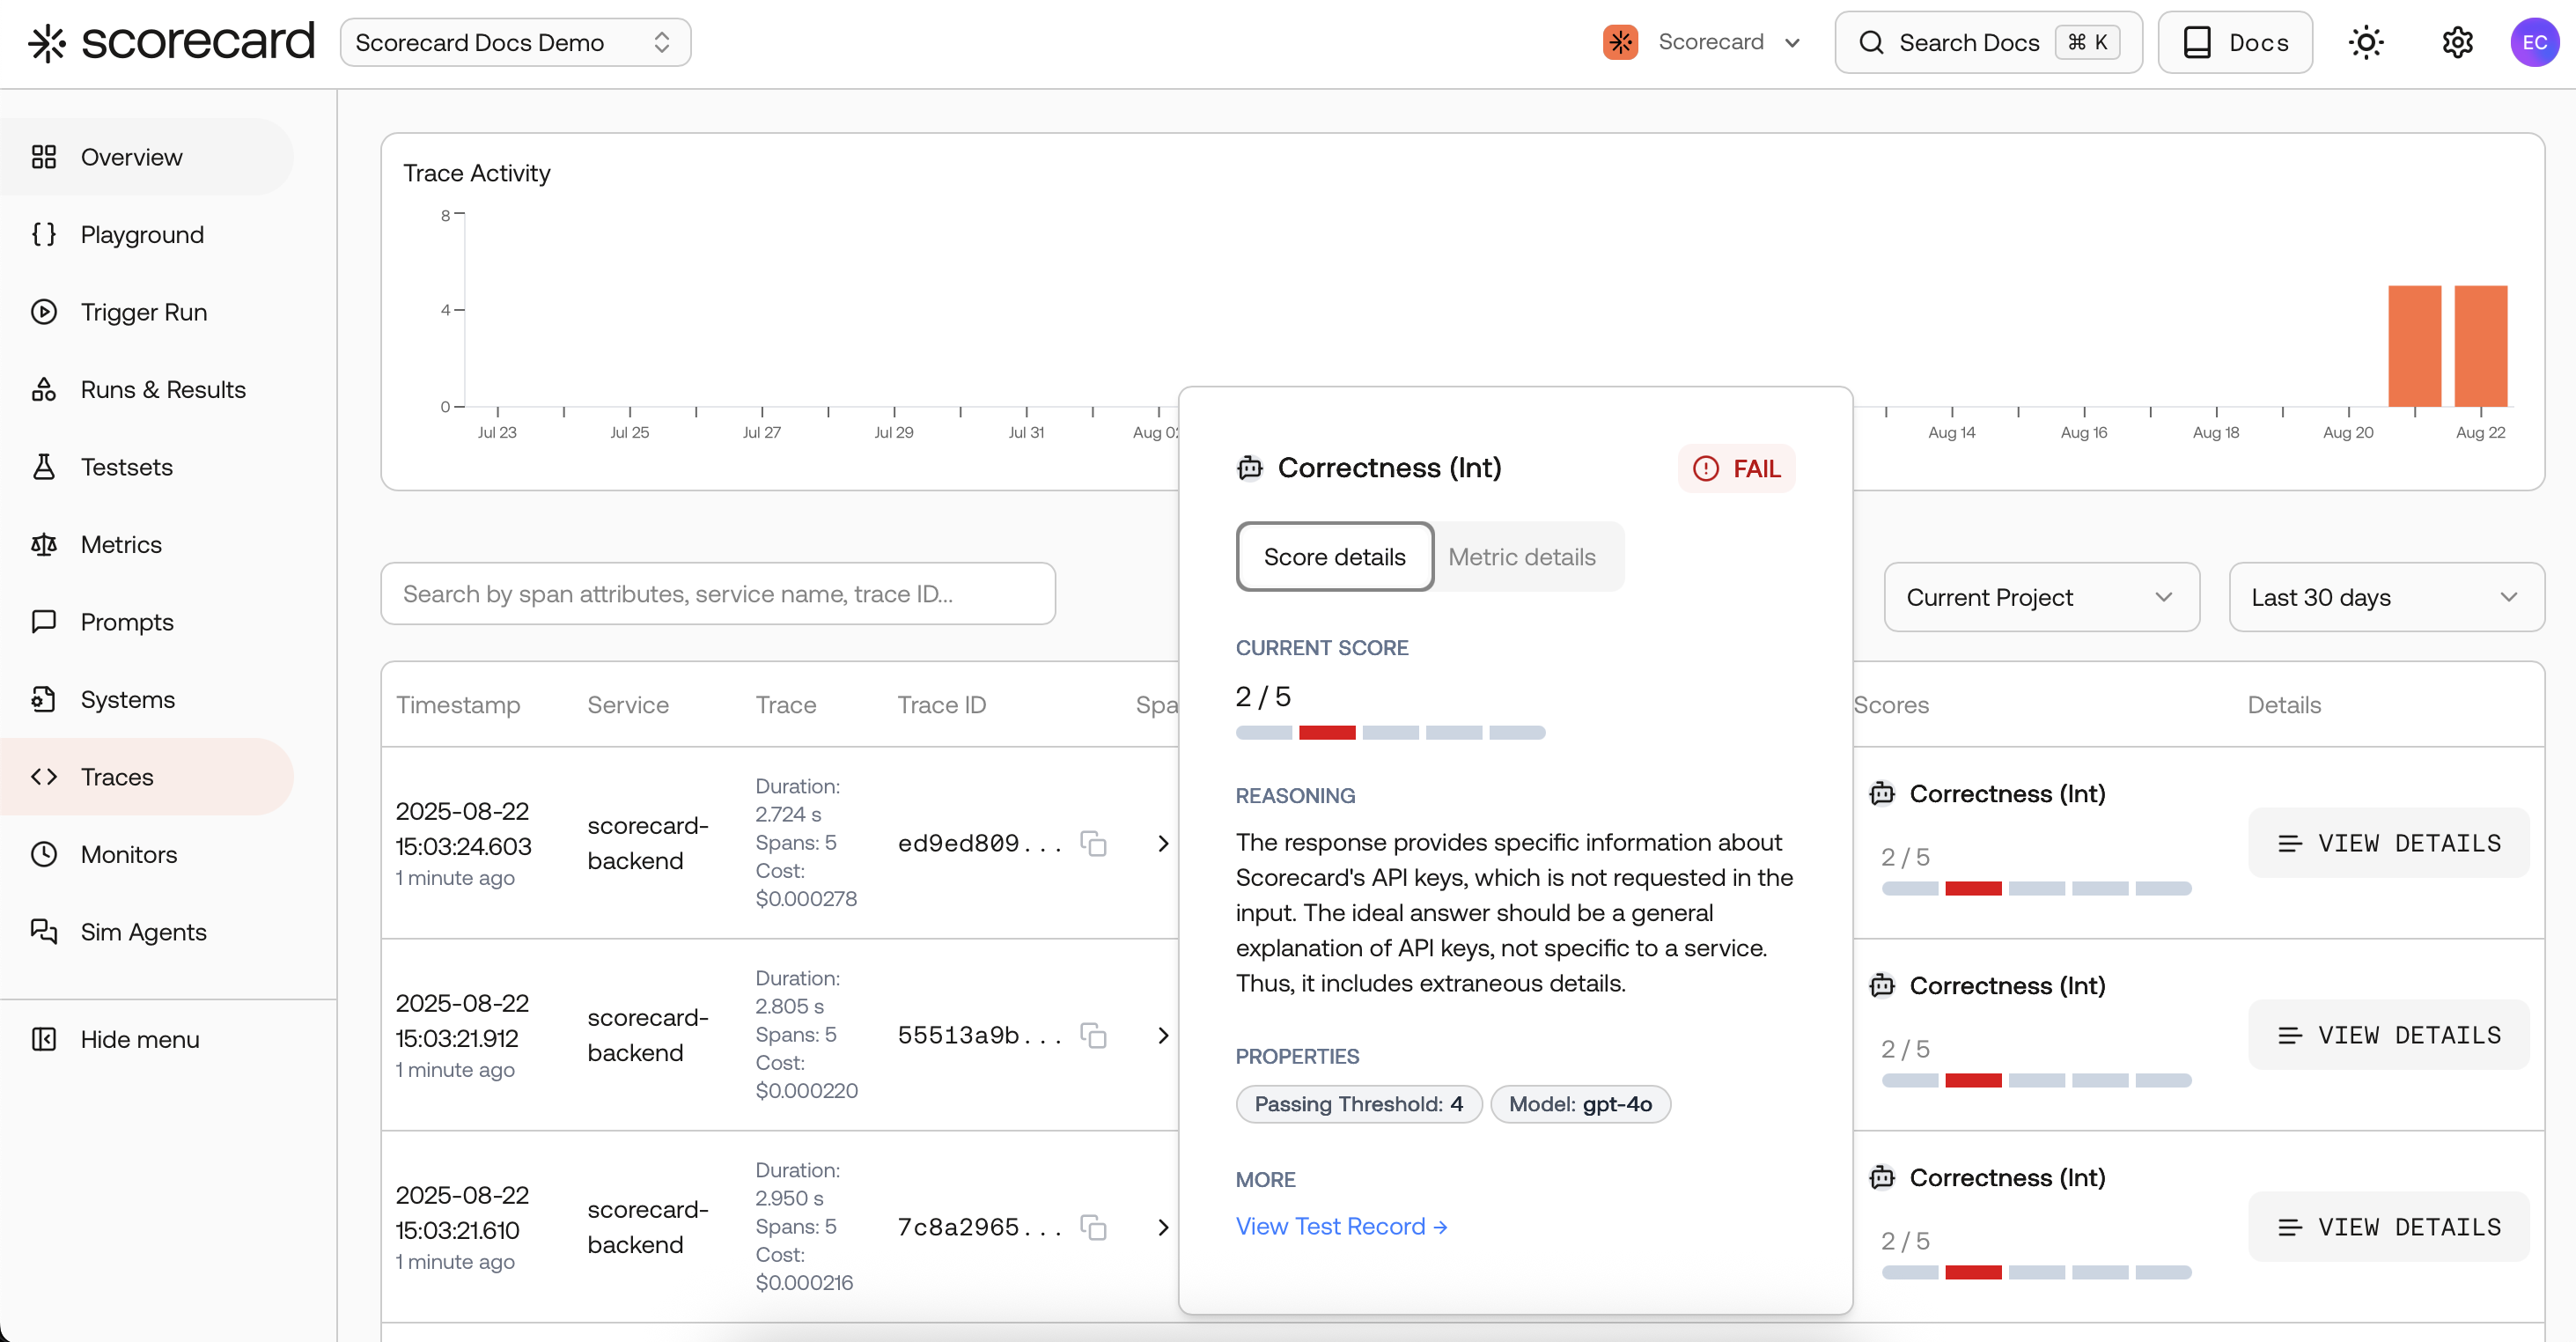
Monitor results – production traces with scores.
Why it matters
- Measure real production quality and safety continuously, not just in staging.
- Detect drift early and pinpoint regressions to specific topics or services.
- Close the loop between observability and evaluation with automatic scoring.
- Quantify improvements after model/prompt updates with linked runs and trends.
If you’re coming from other tools
- What it is: Very similar to observability dashboards (metrics over time, traces, filtering) — with one key addition: Scorecard runs evaluations/auto‑scoring on sampled traces, so you get quality metrics over time, not just system metrics.
- Where scores show up: Inline on Traces for each scored span, and in Runs where you can analyze run‑level aggregates and trends.
- What’s evaluated: Only spans that contain prompt and completion are scored; we support common keys (
openinference.*,ai.prompt/ai.response,gen_ai.*).
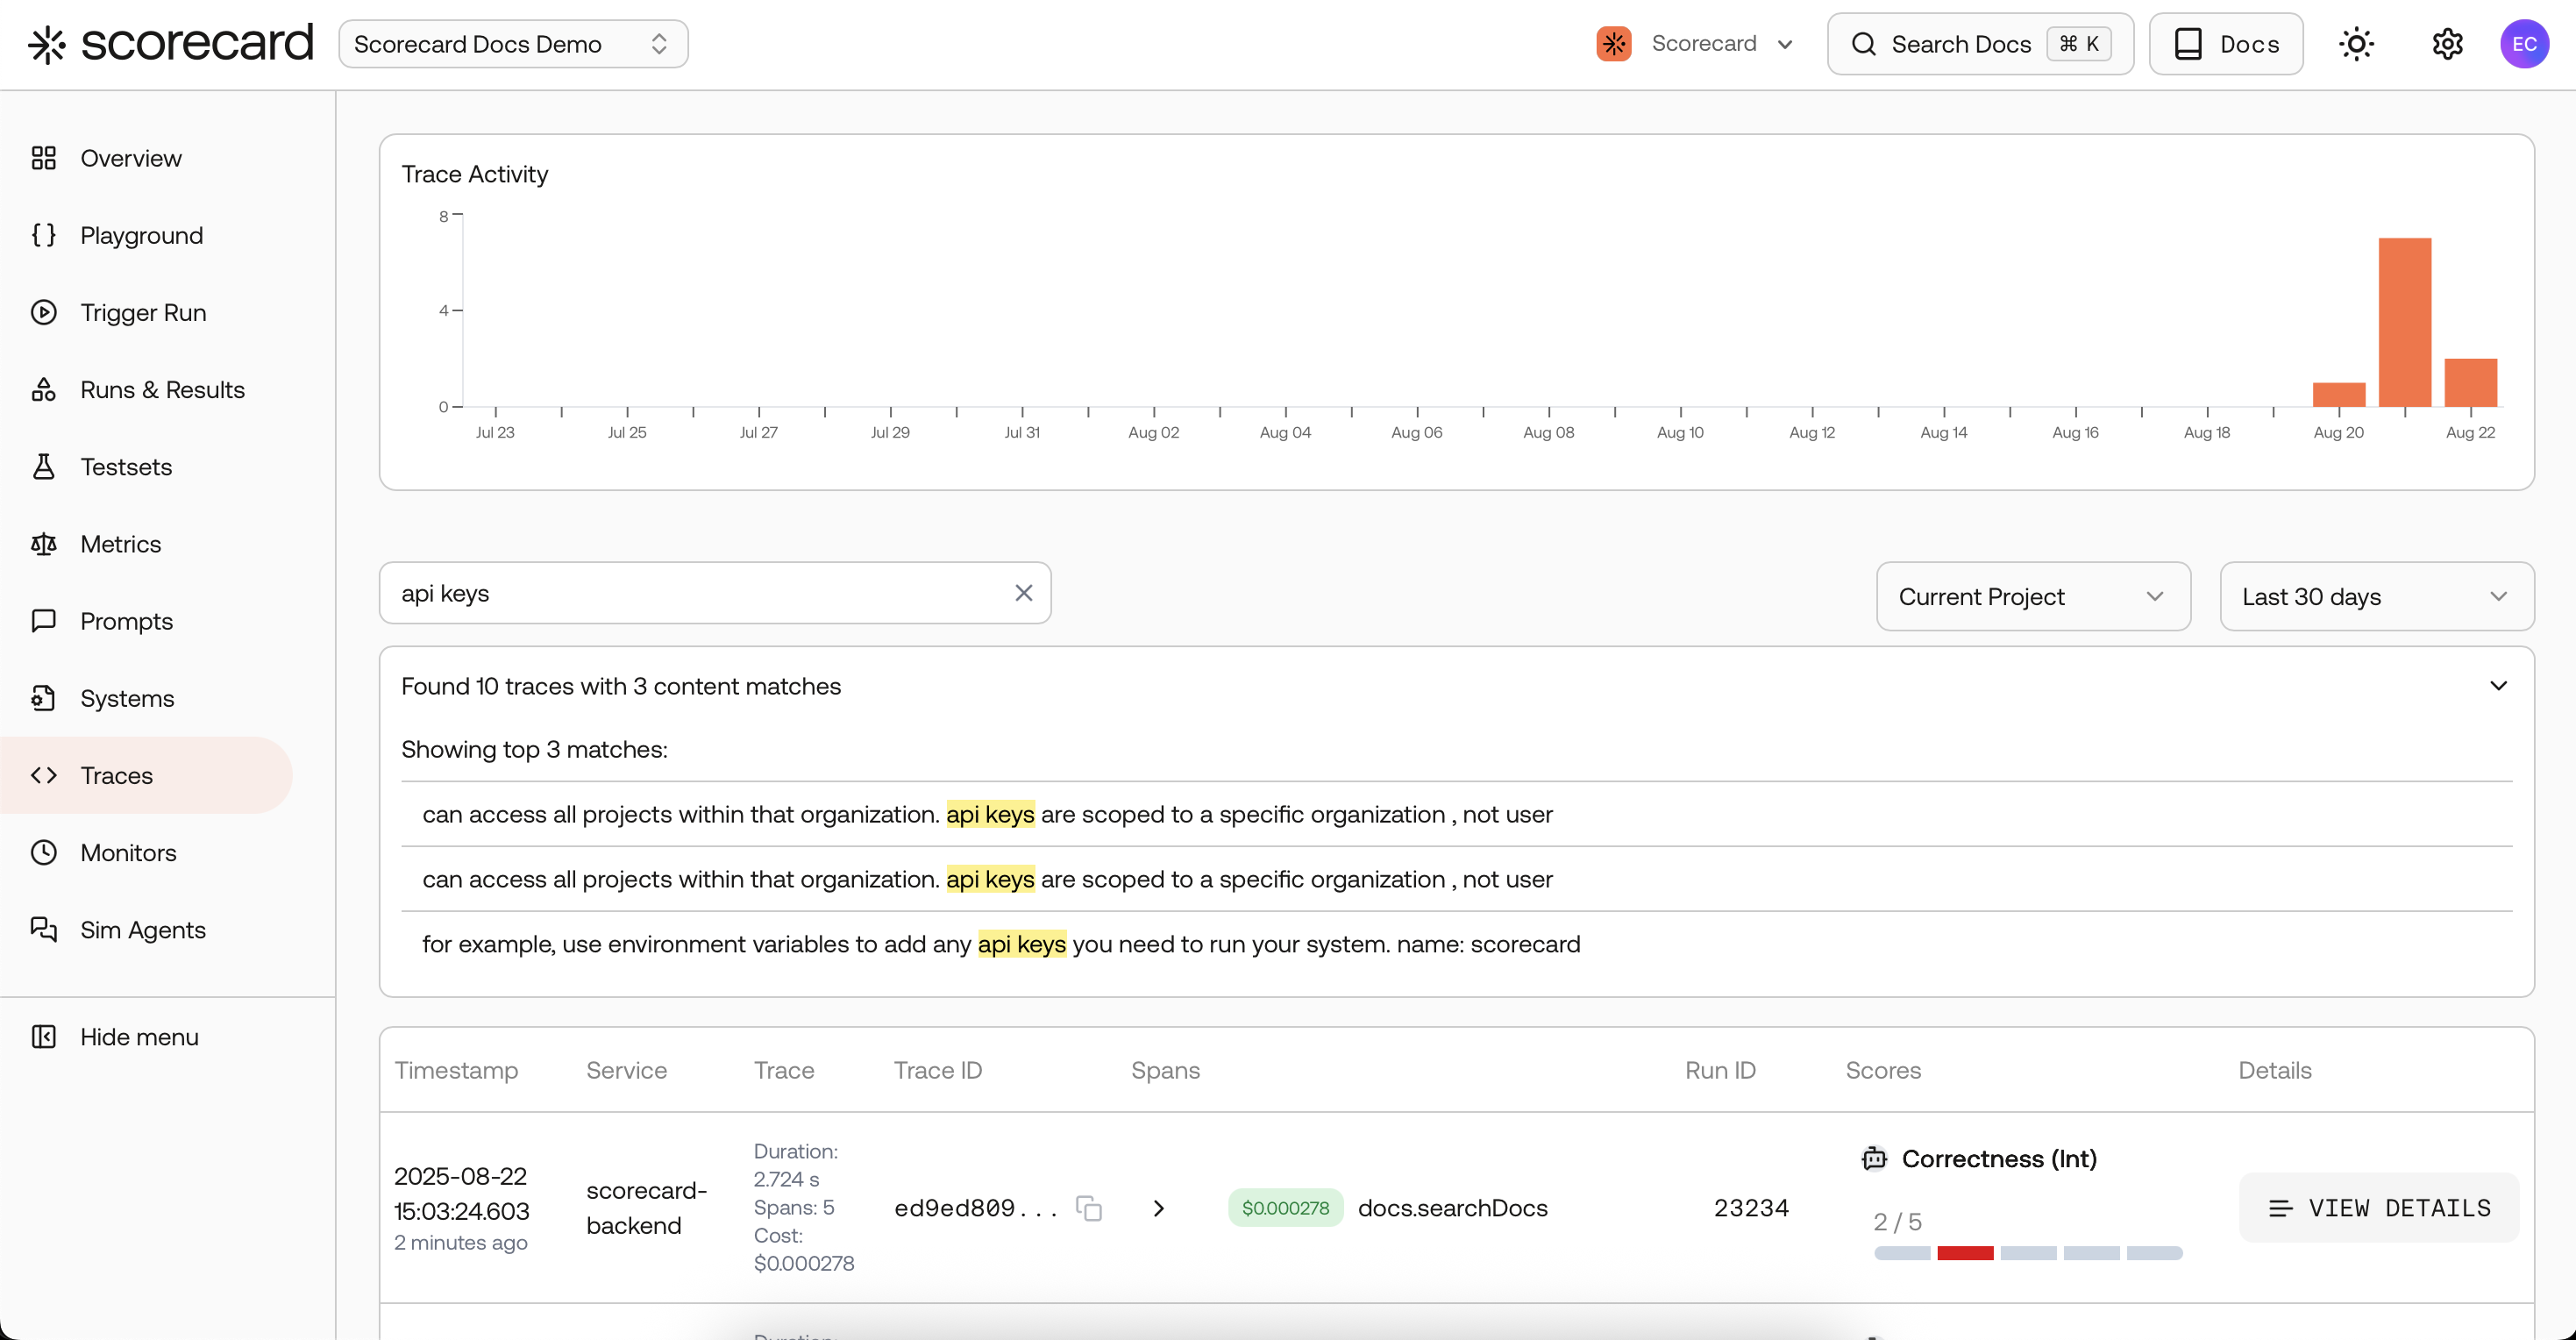
Traces search page with scores created by a 'monitor'.
Create a Monitoring Rule
- Navigate to the Traces page in your project. You’ll see the monitoring rules overview table at the top of the page.
- Click “Add +” to open the Create Monitor modal.
- Click Create Monitor and scoring starts on the next cycle.
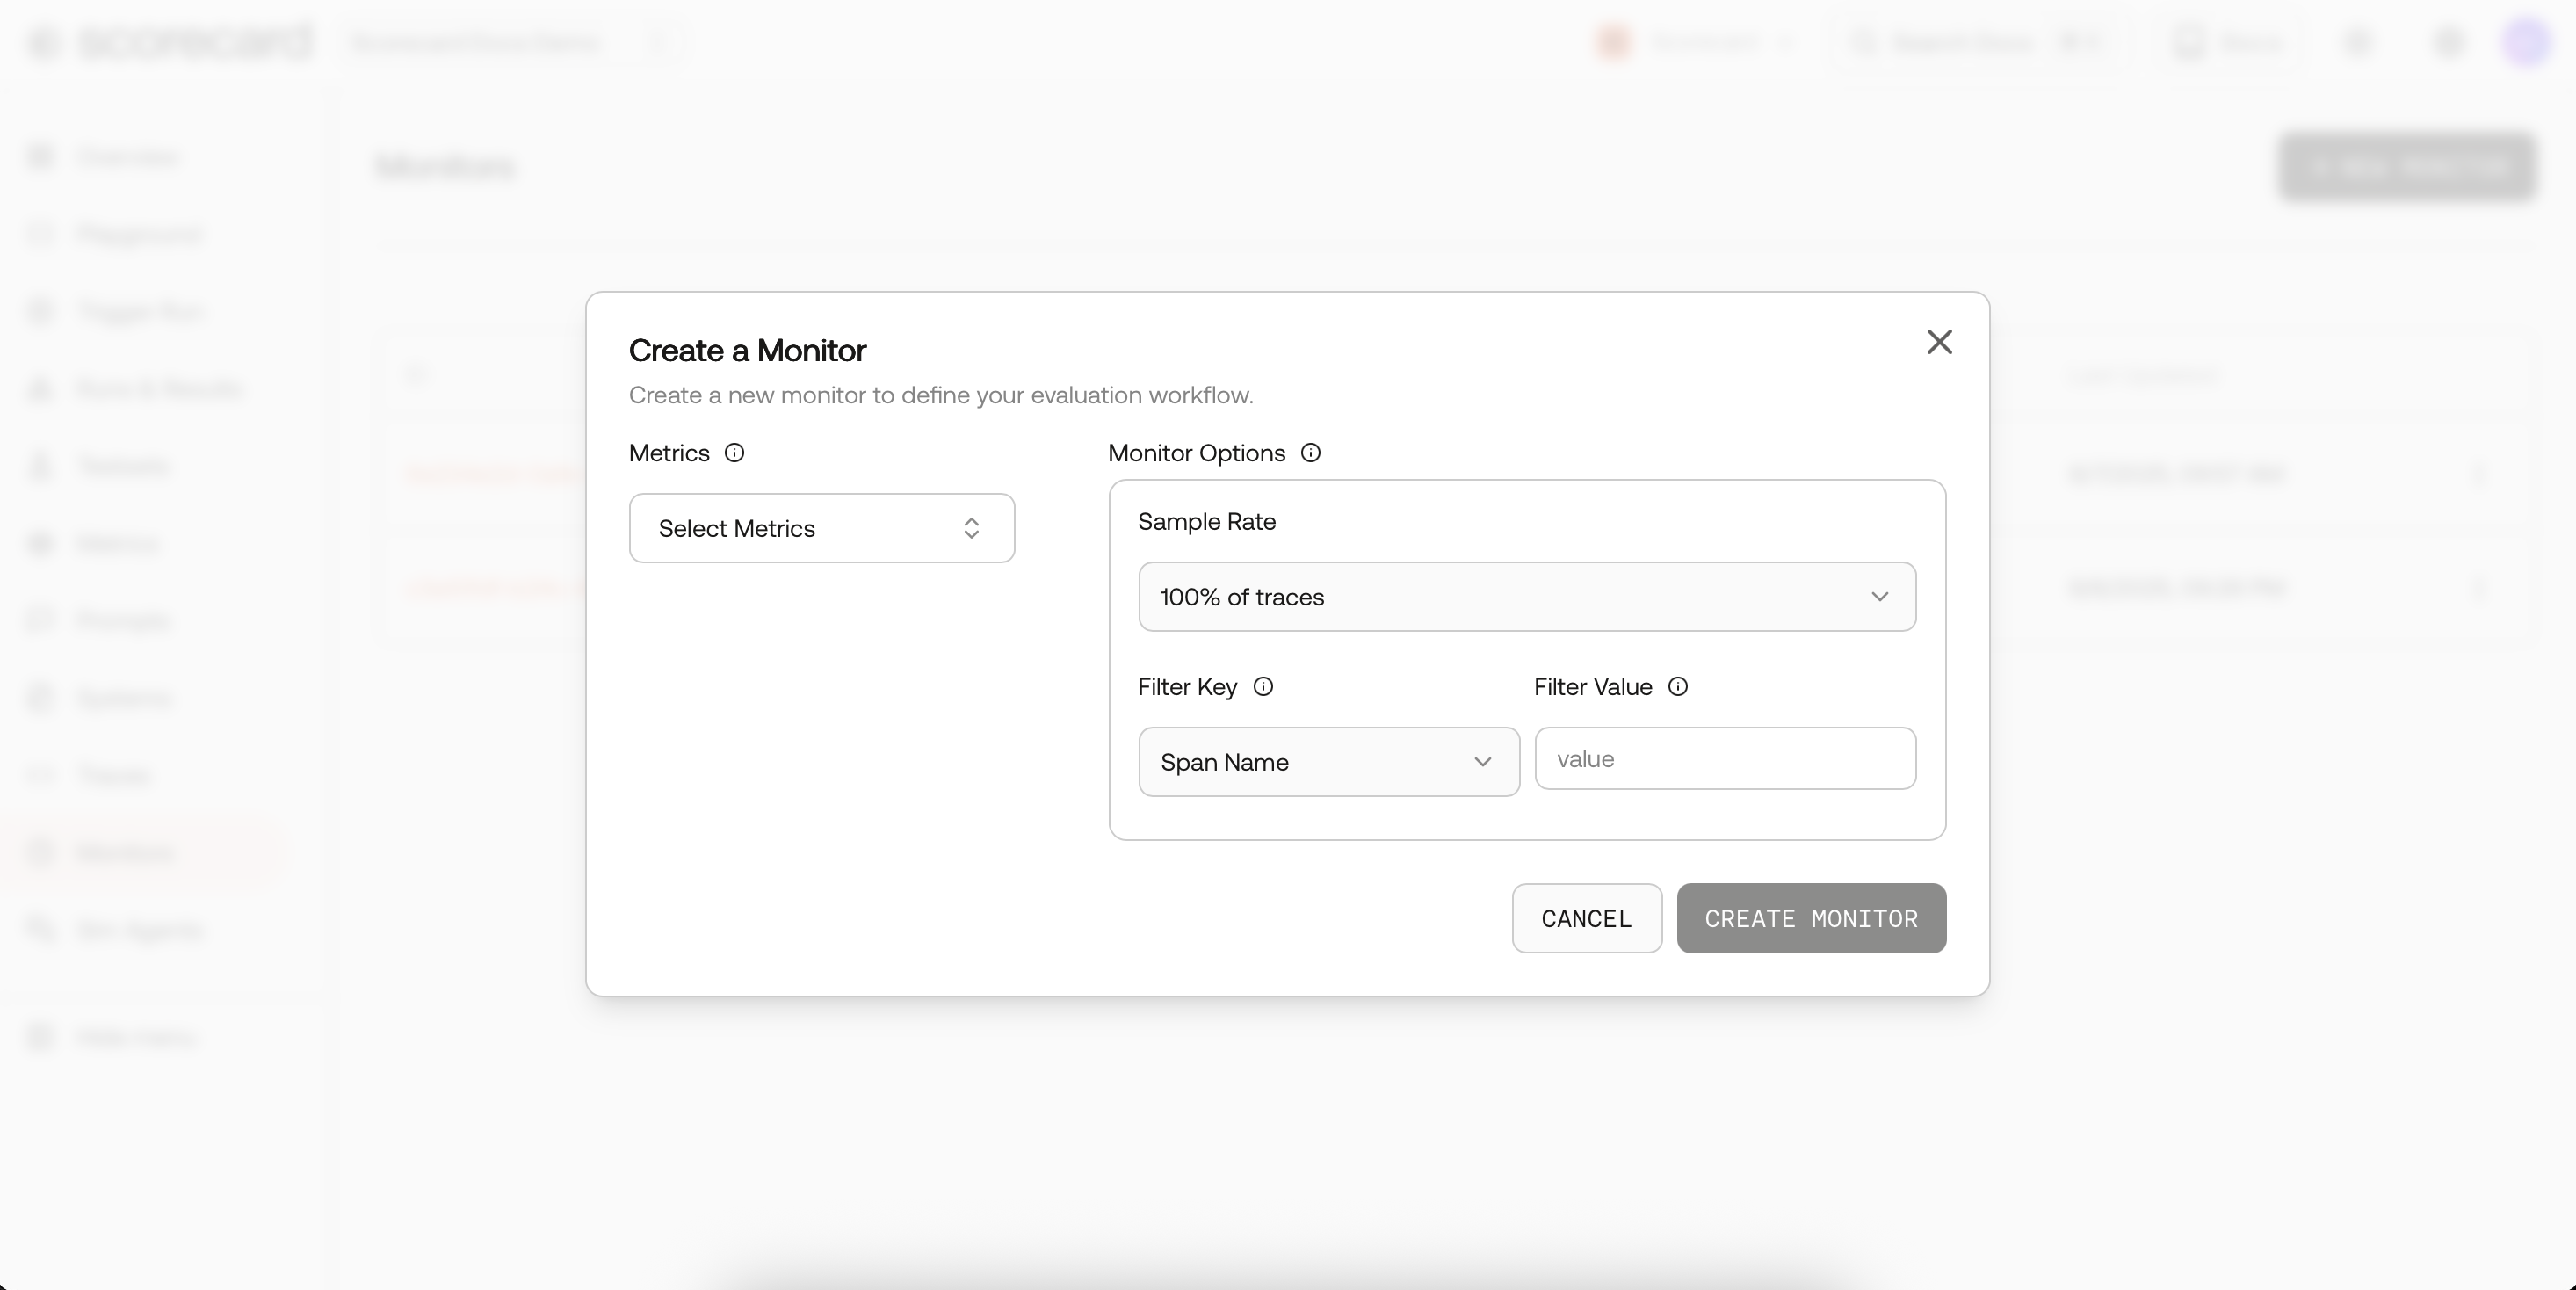
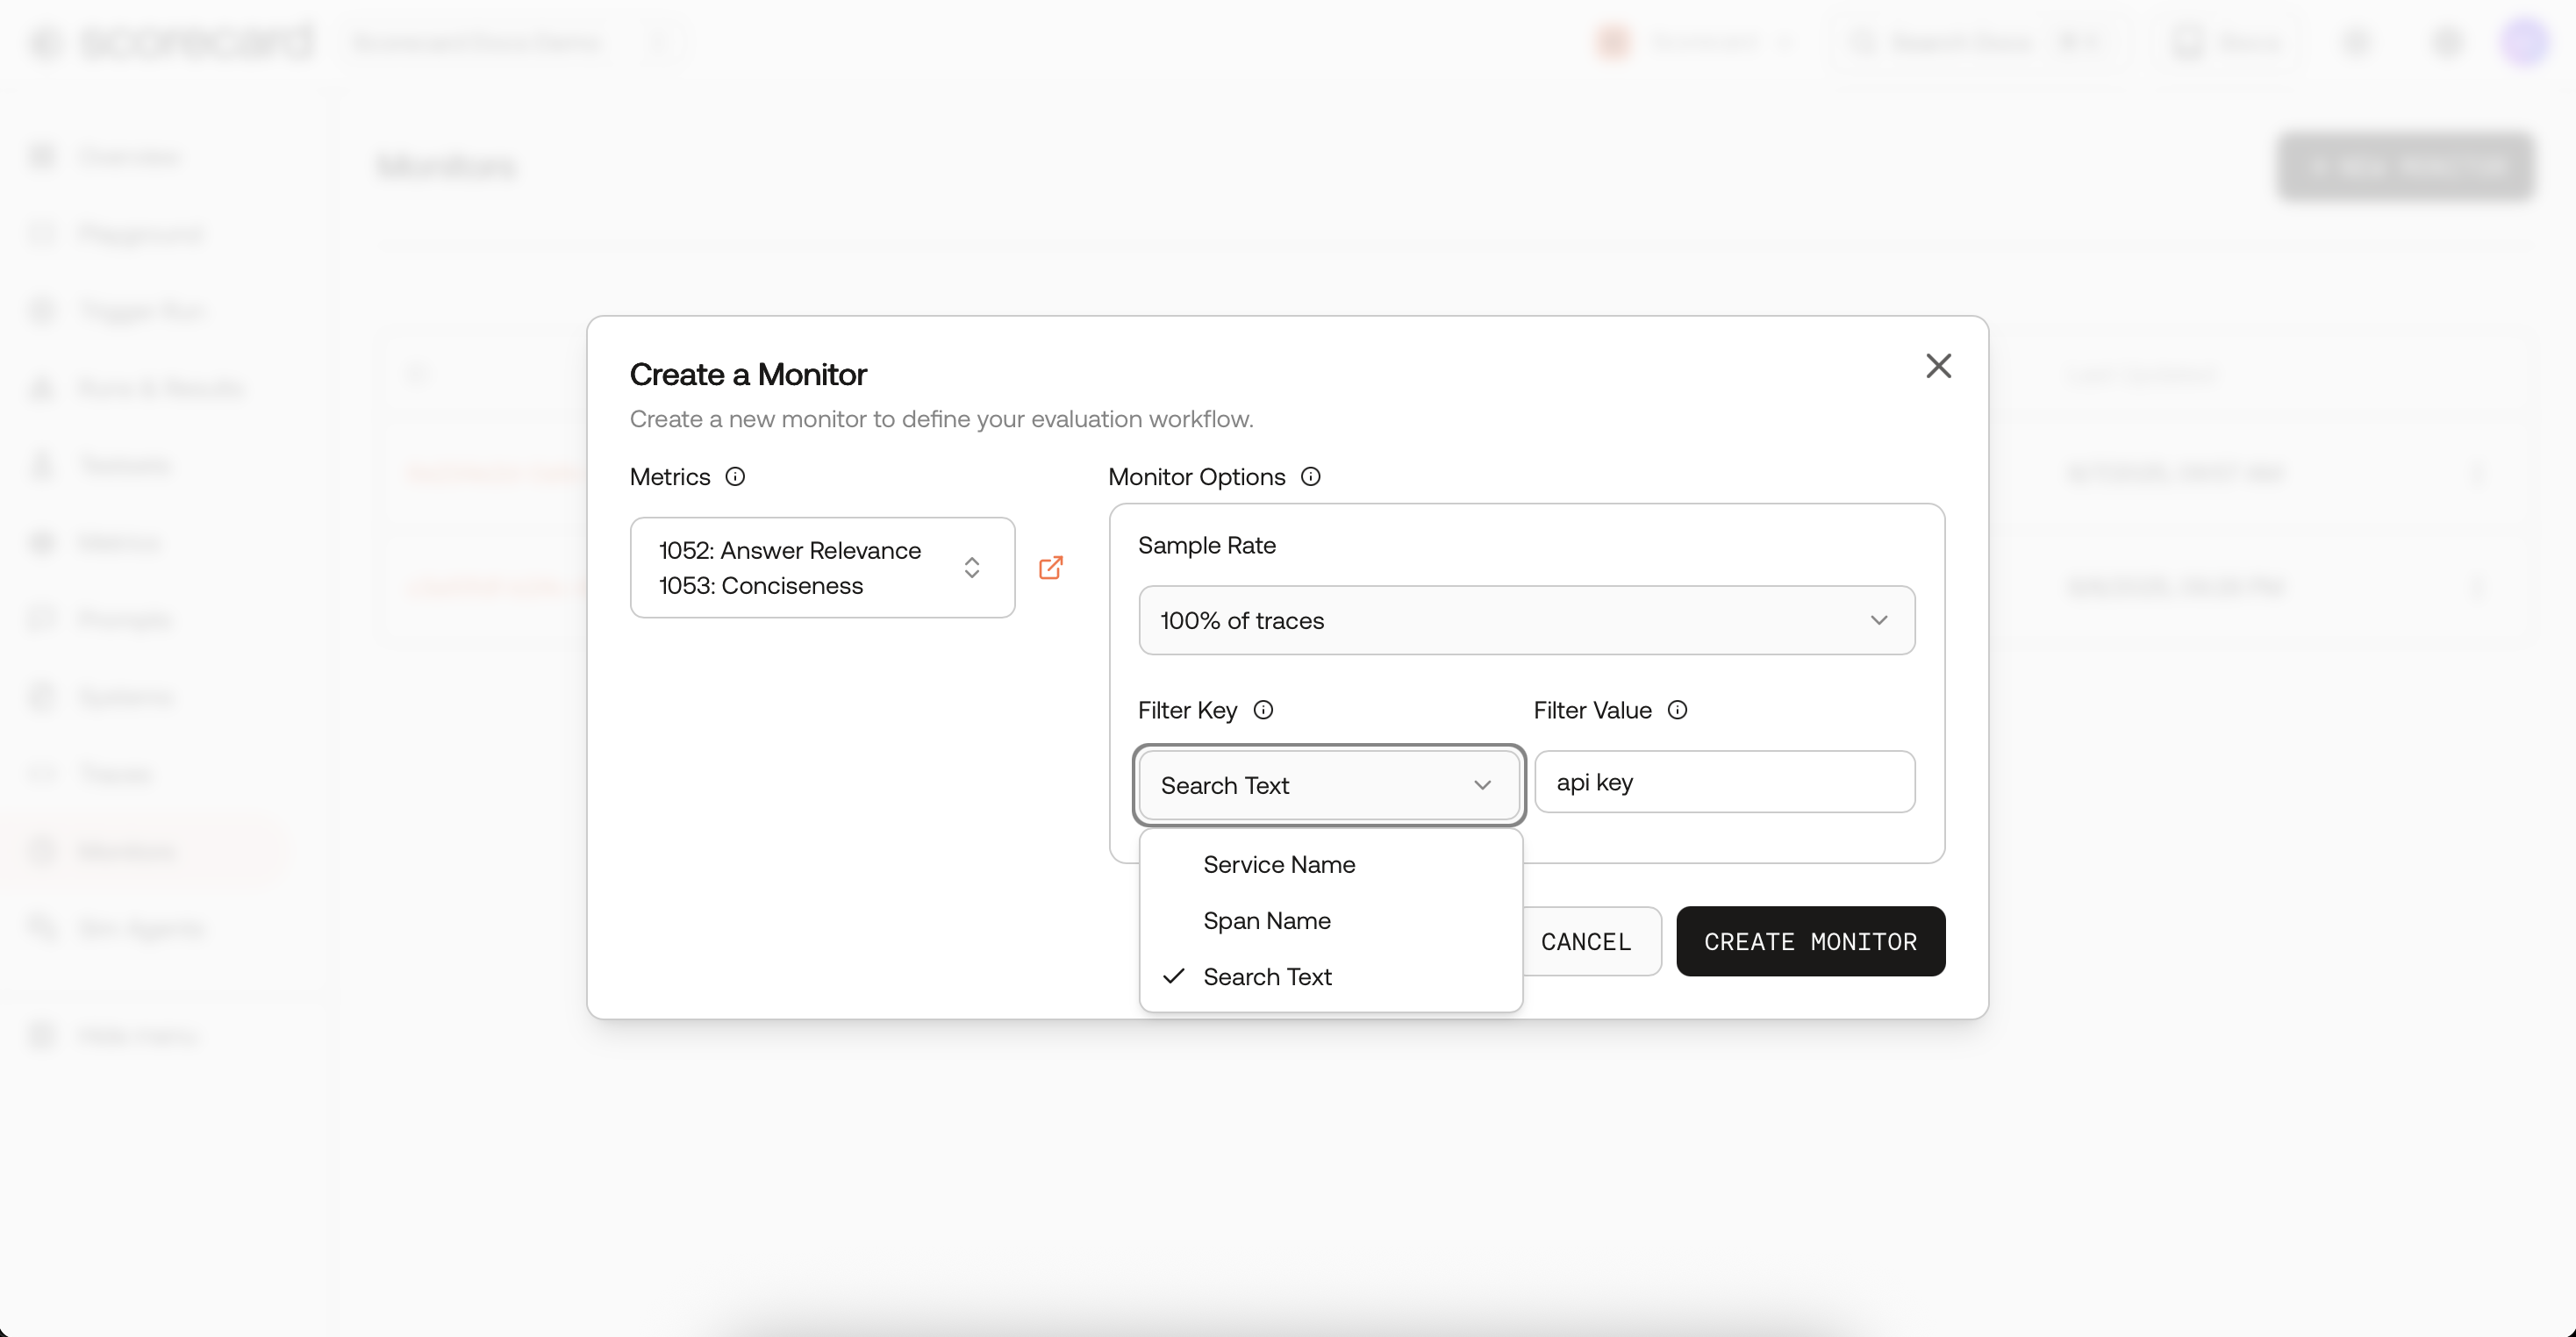
Create monitor modal.
- Metrics – choose any evaluation metric you’ve defined (toxicity, factuality, latency…).
- Frequency – how often Scorecard samples traces (1 min, 5 min, 30 min, 1 h, 1 day).
- Sample Rate – throttle evaluation cost (1 %–100 %).
- Filters – hone in on traffic via
spanName,serviceName, or full-text searchText. - Active – flip a switch to pause / resume without losing config.
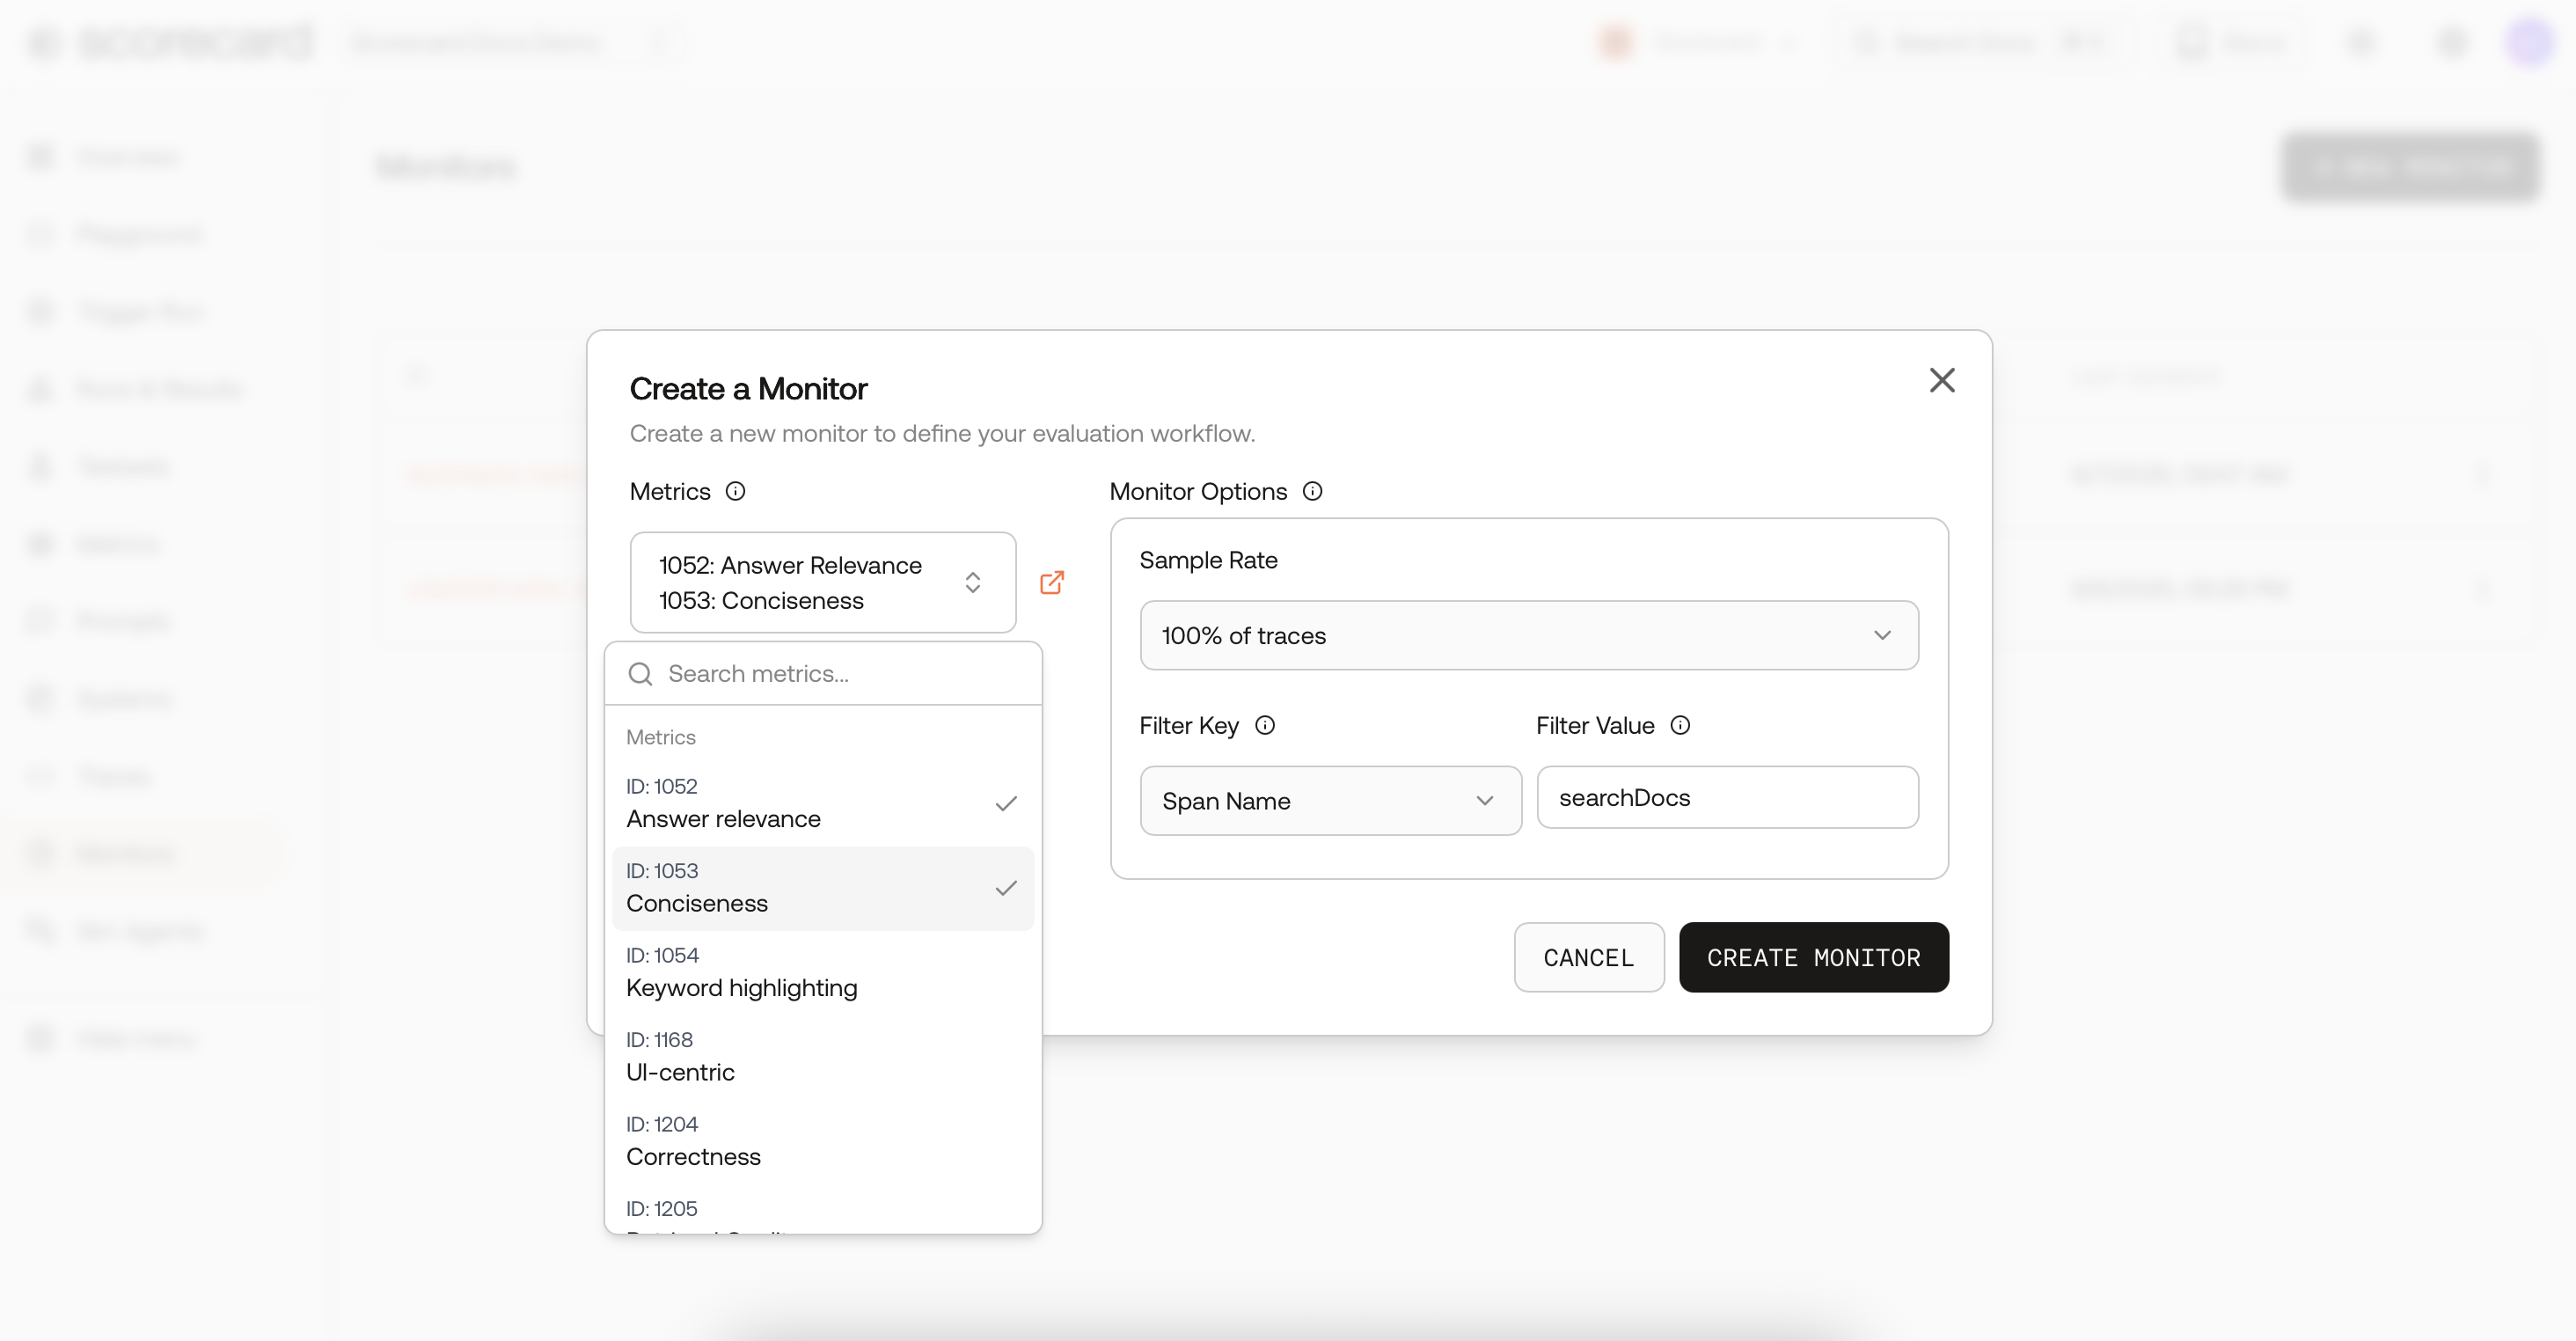
Monitor options – Metrics
Keyword filtering with SearchText
Use SearchText to match any keywords or phrases embedded in your traces. It searches across span and resource attributes (including prompt/response fields), so you can:- Track sensitive topics (e.g., “refund policy”, “PCI”, “unsafe”) as dedicated monitors
- Isolate incident-related traffic and watch the quality recover
- Run targeted evaluations for specific features, intents, or cohorts
Monitor options – sample & filter.
What happens after it runs
- Monitors sample recent AI spans using deterministic, hash‑based sampling (stable slices) and create a Run.
- Each sampled span is scored and appears inline on the Traces page with score chips; click any row to open the full trace.
- From a scored trace you can follow the link to the corresponding Run to see run‑level details.
Where to view results
- Traces: Browse scored spans, filter by keywords with SearchText, and jump into details for debugging.
- Runs: See run history and performance over time, plus per‑run aggregates and plots on the run details pages.
Monitor results – Scores.
Manage monitors
- Edit a monitor to change metrics, sampling, filters or toggle Active.
- Delete a monitor to stop processing entirely.
- Run now to trigger a monitor immediately without waiting for the next scheduled run. You can also specify a custom lookback time range to evaluate traces from a specific period.
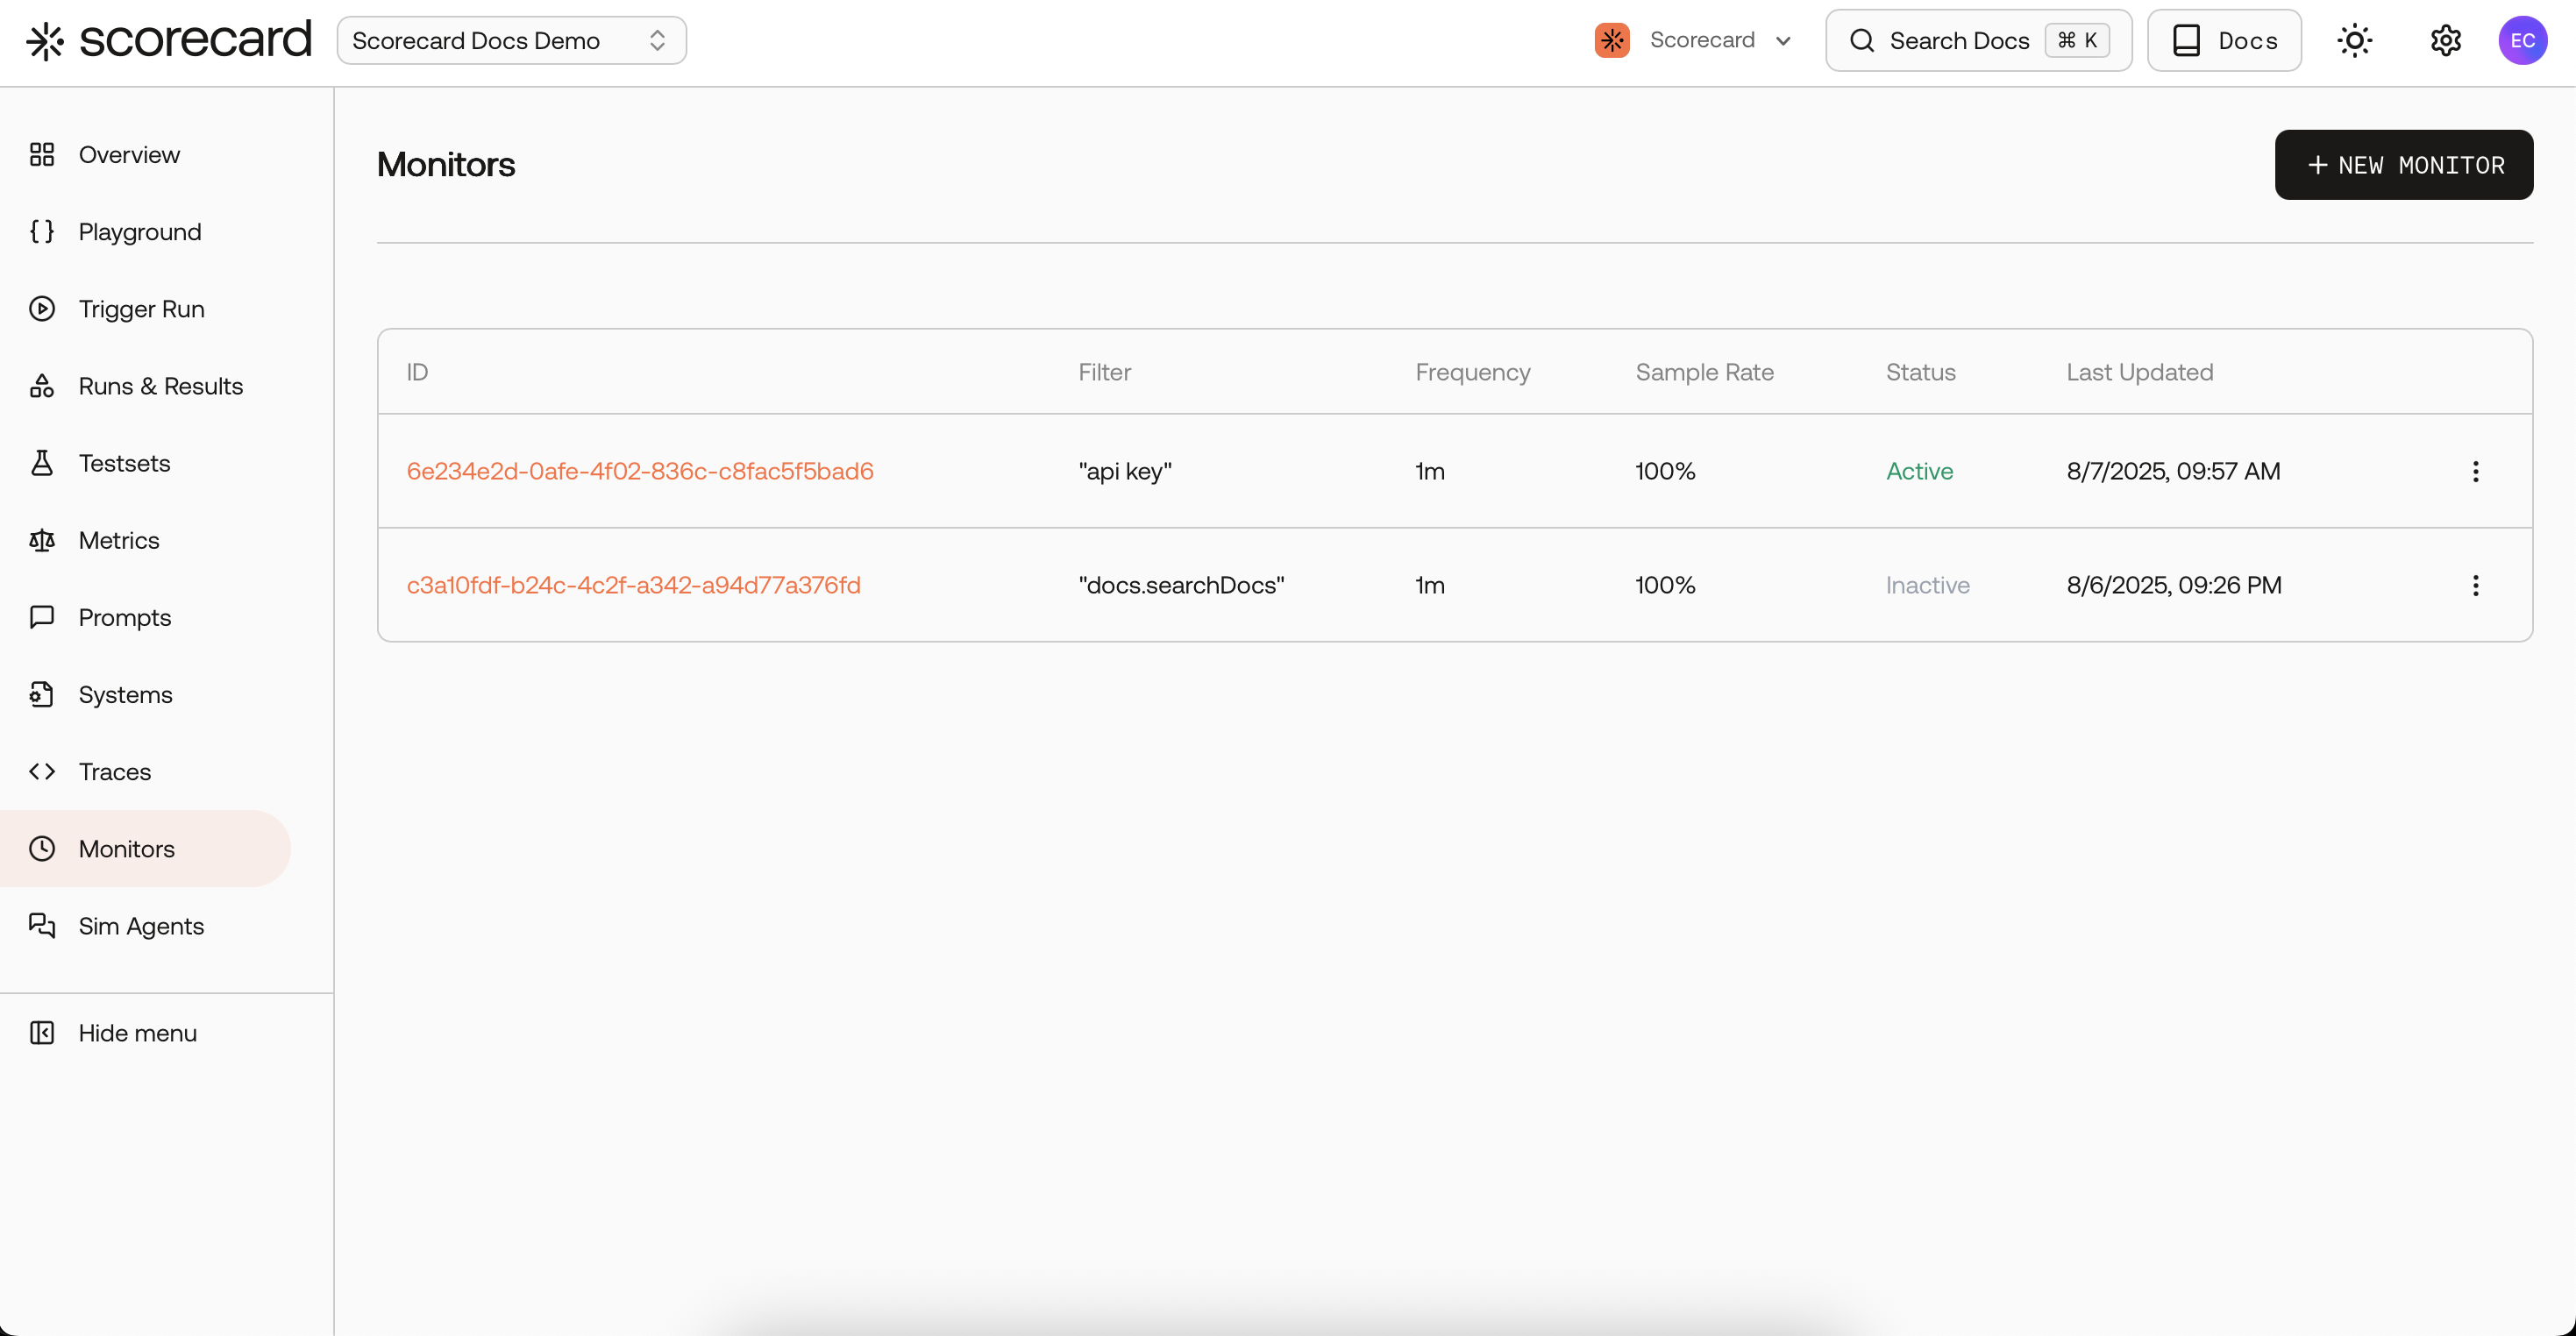
Monitor overview list.
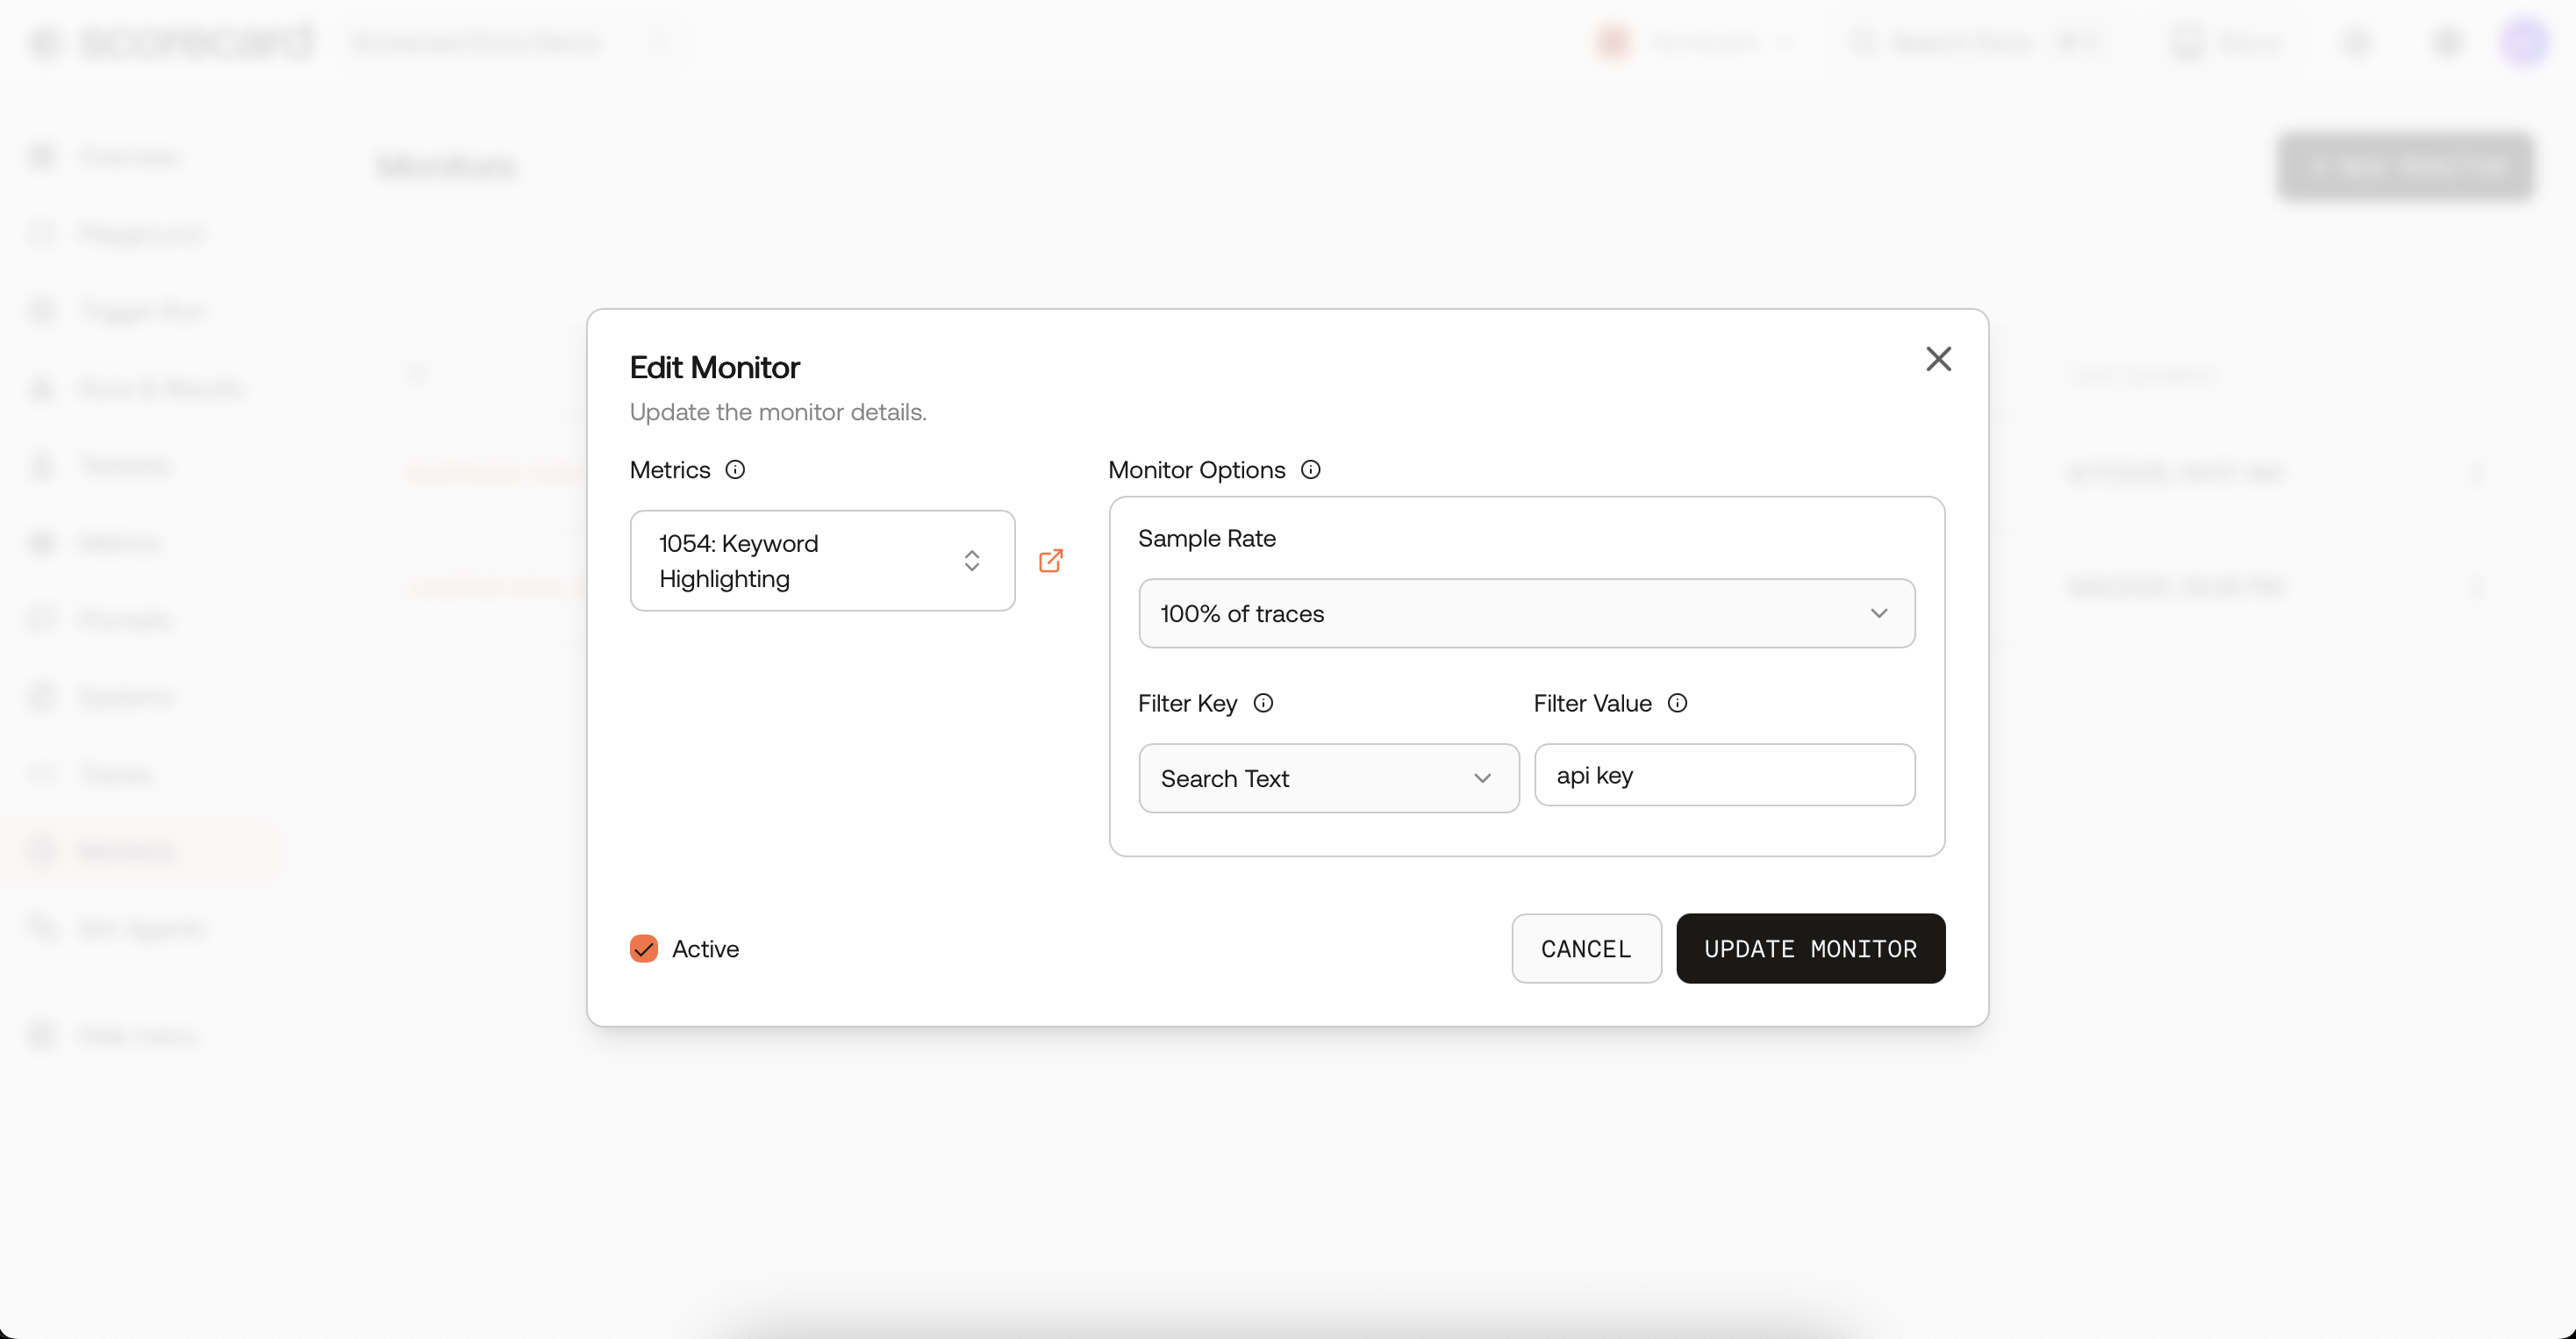
Edit monitor modal.
Use cases
- Production monitoring of LLM quality and safety
- Auto-scoring on real user traffic
- Tracking model/prompt health over time
Ready to set one up? Follow the Online Evaluation & Production Monitoring Quickstart.