Replace <your_scorecard_api_key> with your actual Scorecard API key (starts with ak_).
3
Initialize tracing
Initialize the Traceloop SDK with LangChain instrumentation before importing LangChain modules.
Import order matters! You must initialize Traceloop before importing any LangChain modules to ensure all calls are properly instrumented.
import osfrom traceloop.sdk import Traceloopfrom traceloop.sdk.instruments import Instruments# Set scorecard.project_id to route traces to a specific project (defaults to oldest project)Traceloop.init( disable_batch=True, instruments={Instruments.LANGCHAIN}, resource_attributes={ "scorecard.project_id": os.getenv("SCORECARD_PROJECT_ID") })# Now import your LangChain modulesfrom langchain_openai import ChatOpenAIfrom langchain_core.prompts import ChatPromptTemplate
4
Run your LangChain application
With tracing initialized, run your LangChain application. All LLM calls, chain executions, and agent actions are automatically traced.Here’s a full example:
example.py
import osfrom traceloop.sdk import Traceloopfrom traceloop.sdk.instruments import Instruments# Set scorecard.project_id to route traces to a specific project (defaults to oldest project)Traceloop.init( disable_batch=True, instruments={Instruments.LANGCHAIN}, resource_attributes={ "scorecard.project_id": os.getenv("SCORECARD_PROJECT_ID") })# Then import LangChainfrom langchain_openai import ChatOpenAIfrom langchain_core.prompts import ChatPromptTemplate# Create a simple chainprompt = ChatPromptTemplate.from_messages([ ("system", "You are a helpful assistant."), ("user", "{input}")])model = ChatOpenAI(model="gpt-4o-mini")chain = prompt | model# Run the chain - this will be tracedresponse = chain.invoke({"input": "What is the capital of France?"})print(response.content)
You may see Failed to export batch warnings in the console. These can be safely ignored - your traces are still being captured and sent to Scorecard successfully.
5
View traces in Scorecard
Navigate to the Records page in Scorecard to see your LangChain traces.
It may take 1-2 minutes for traces to appear on the Records page.
Records page showing LangChain application traces
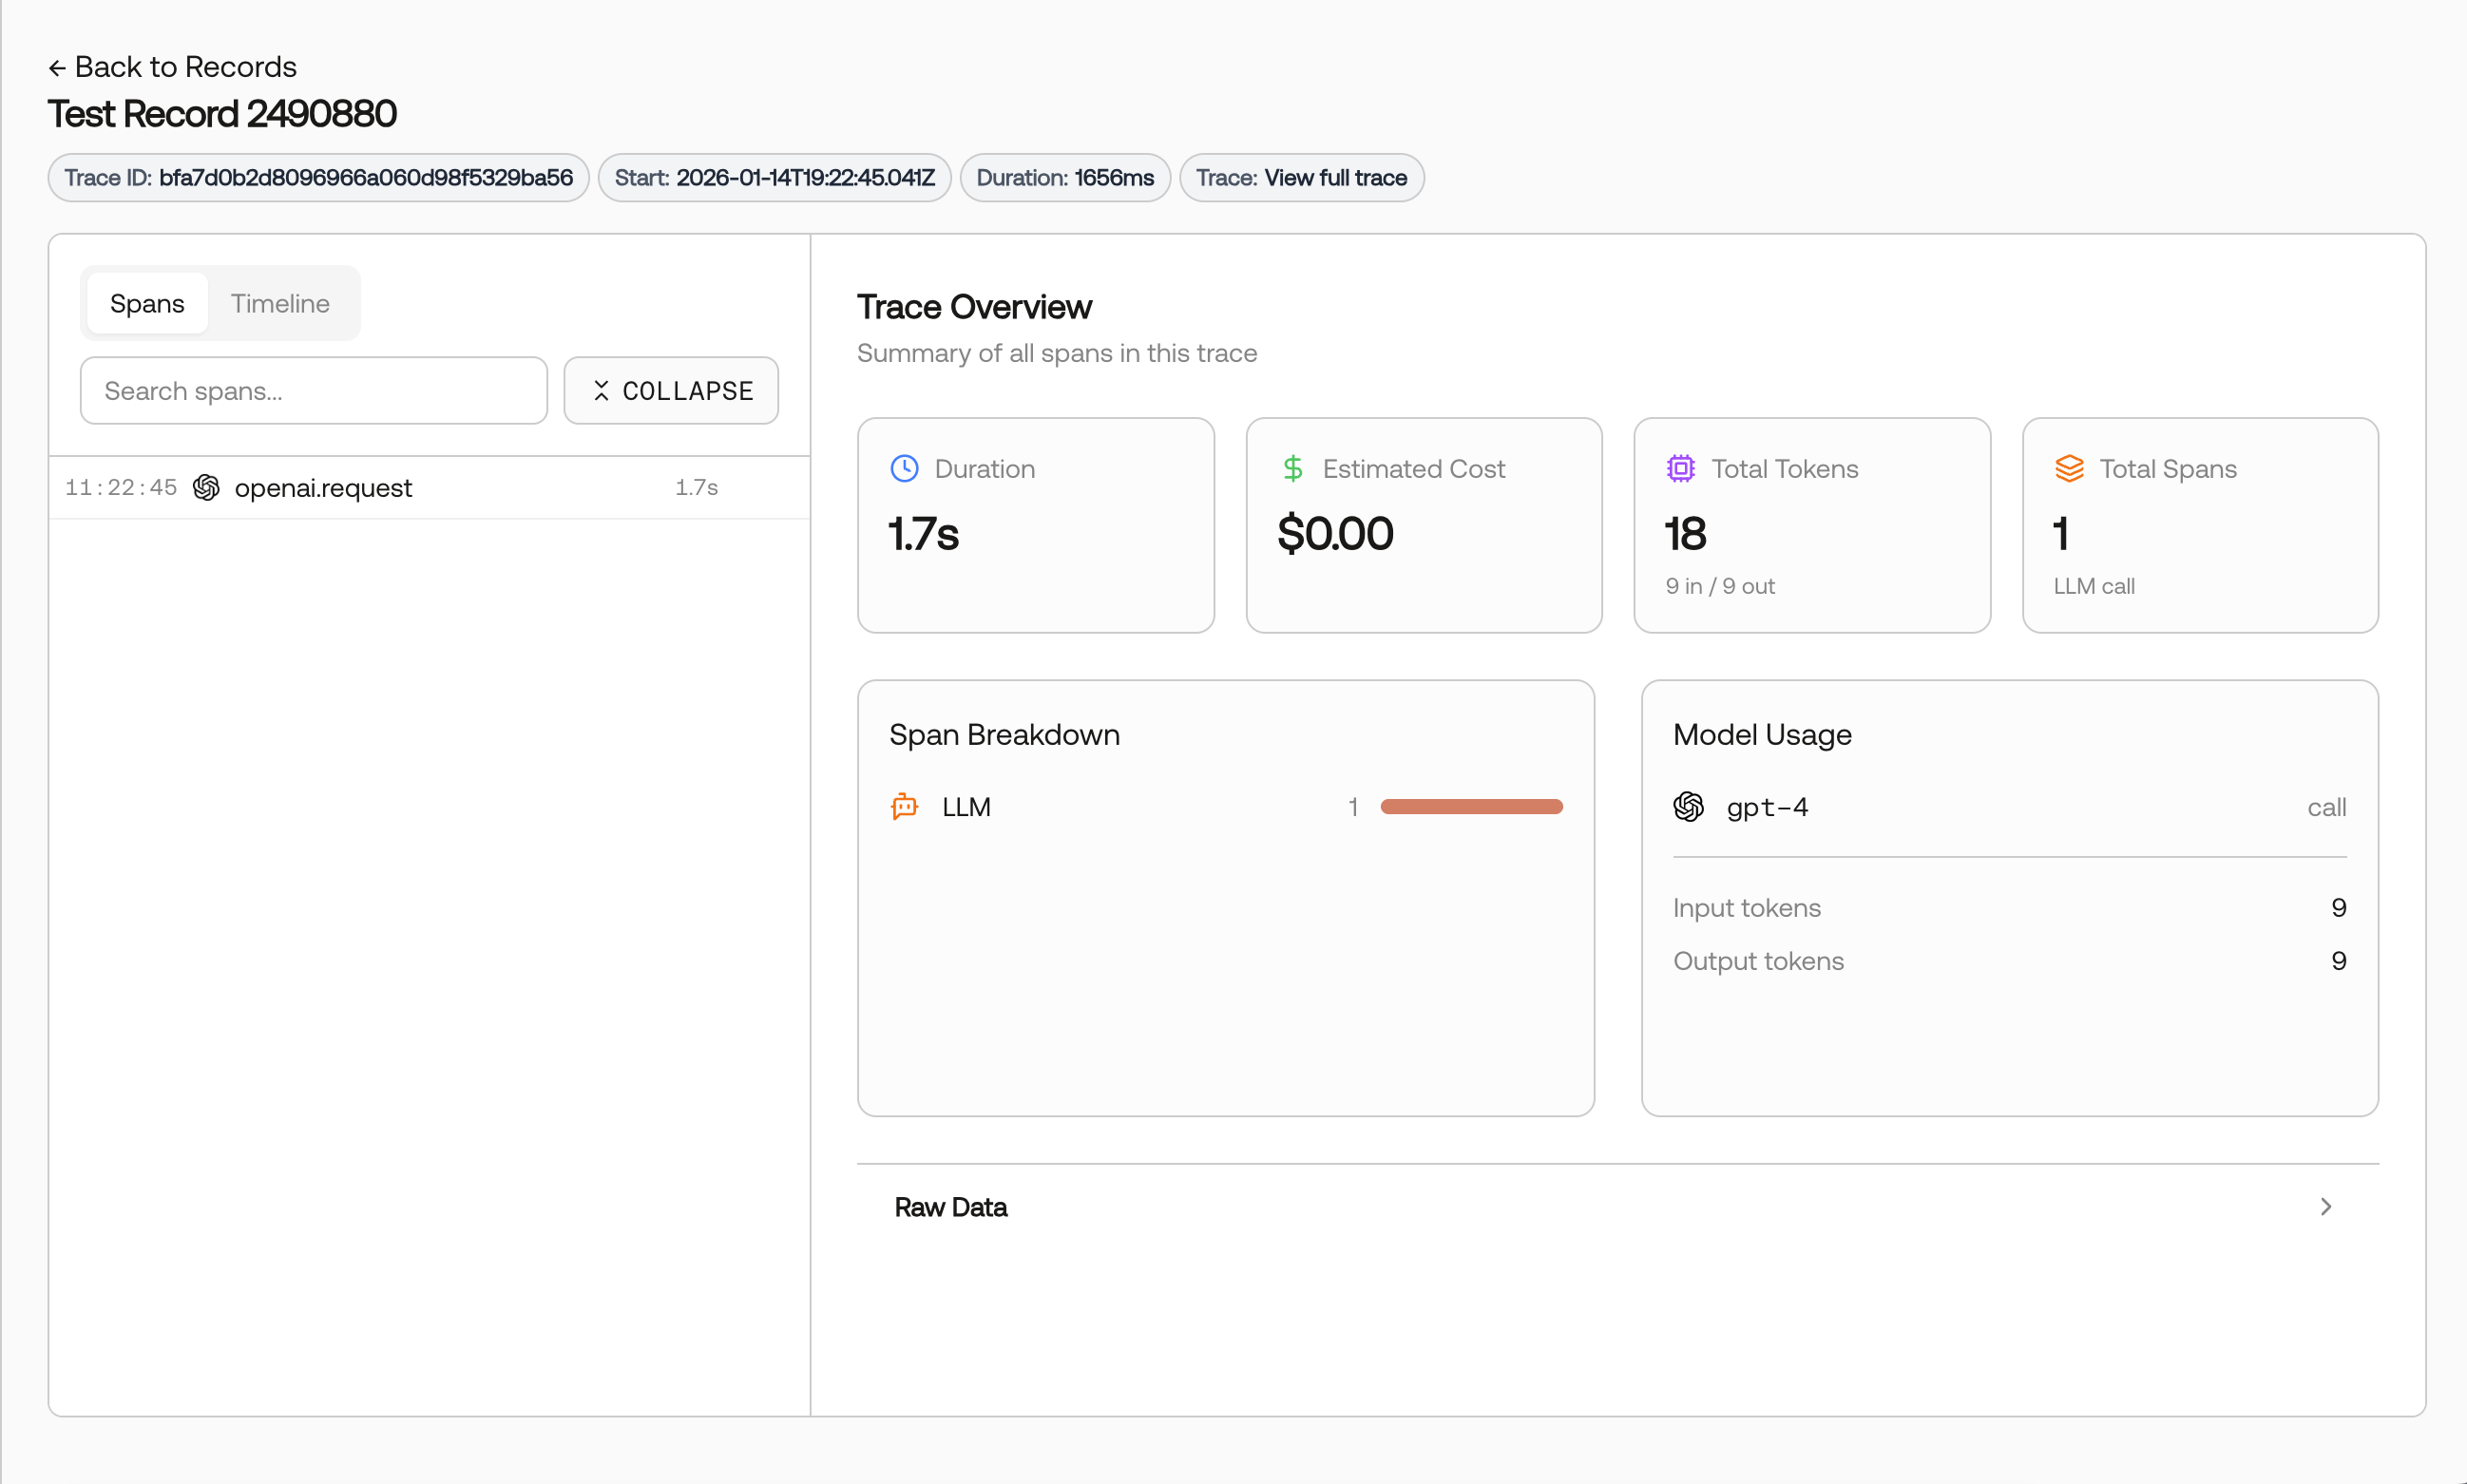
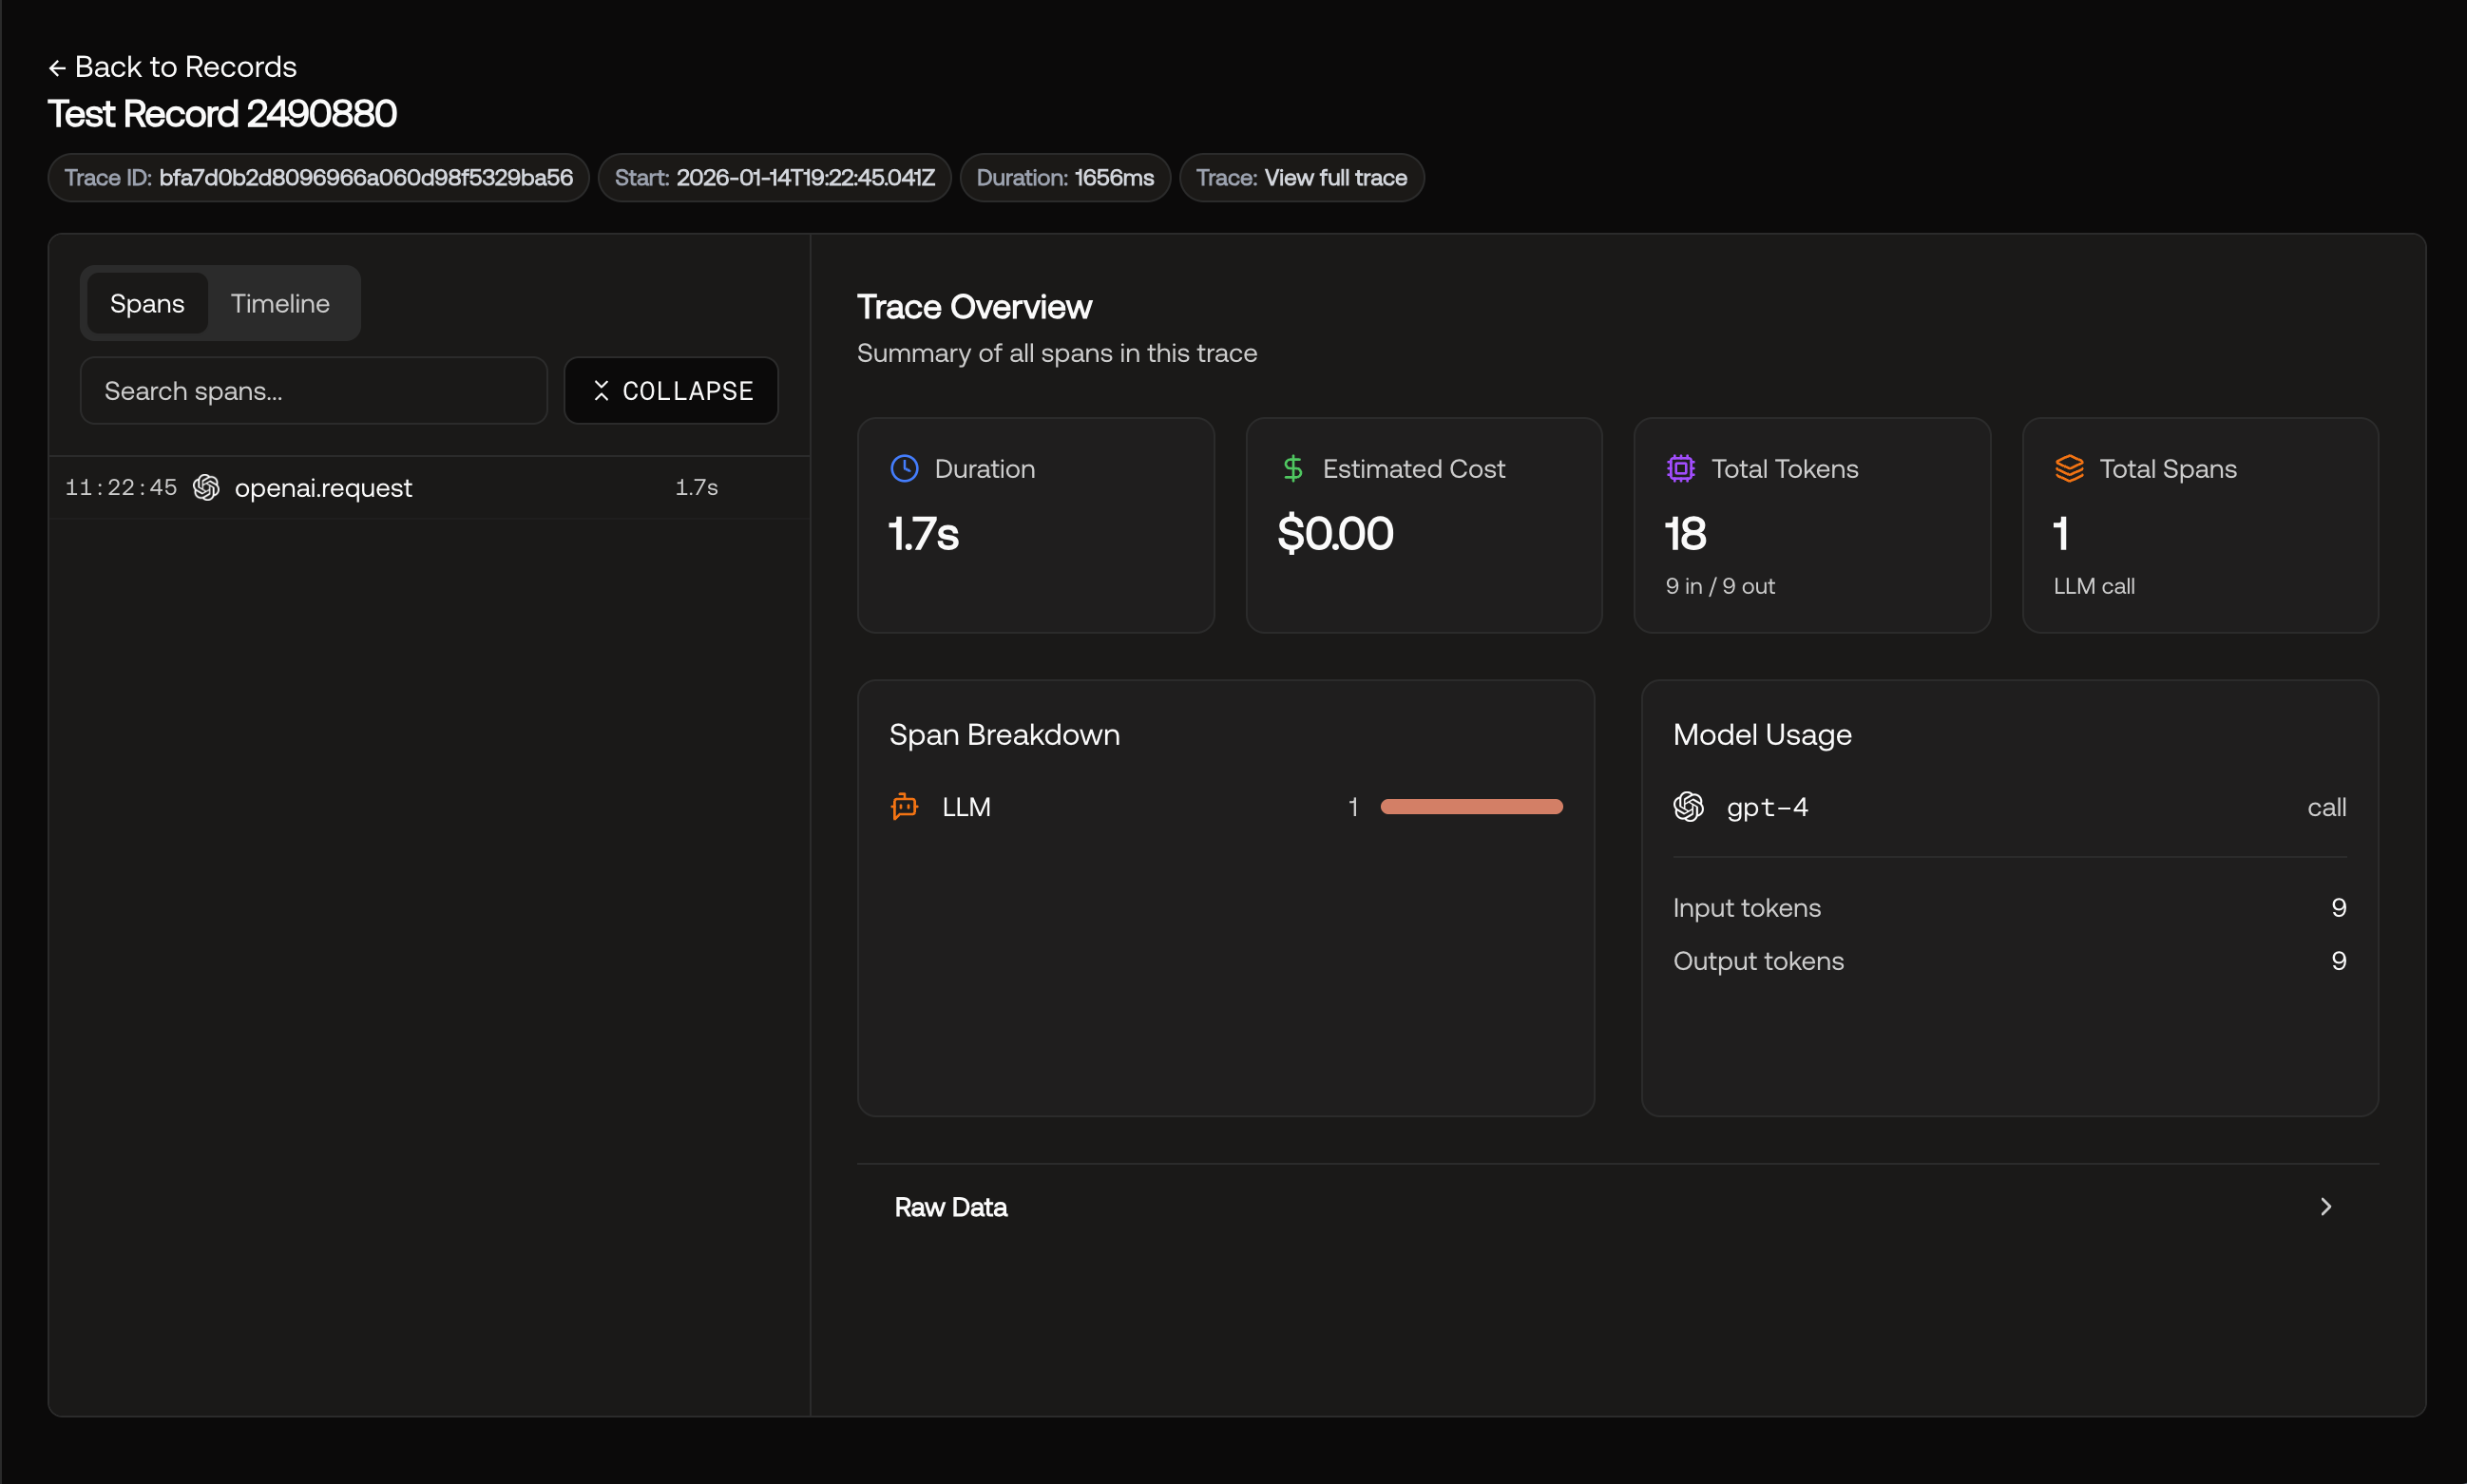
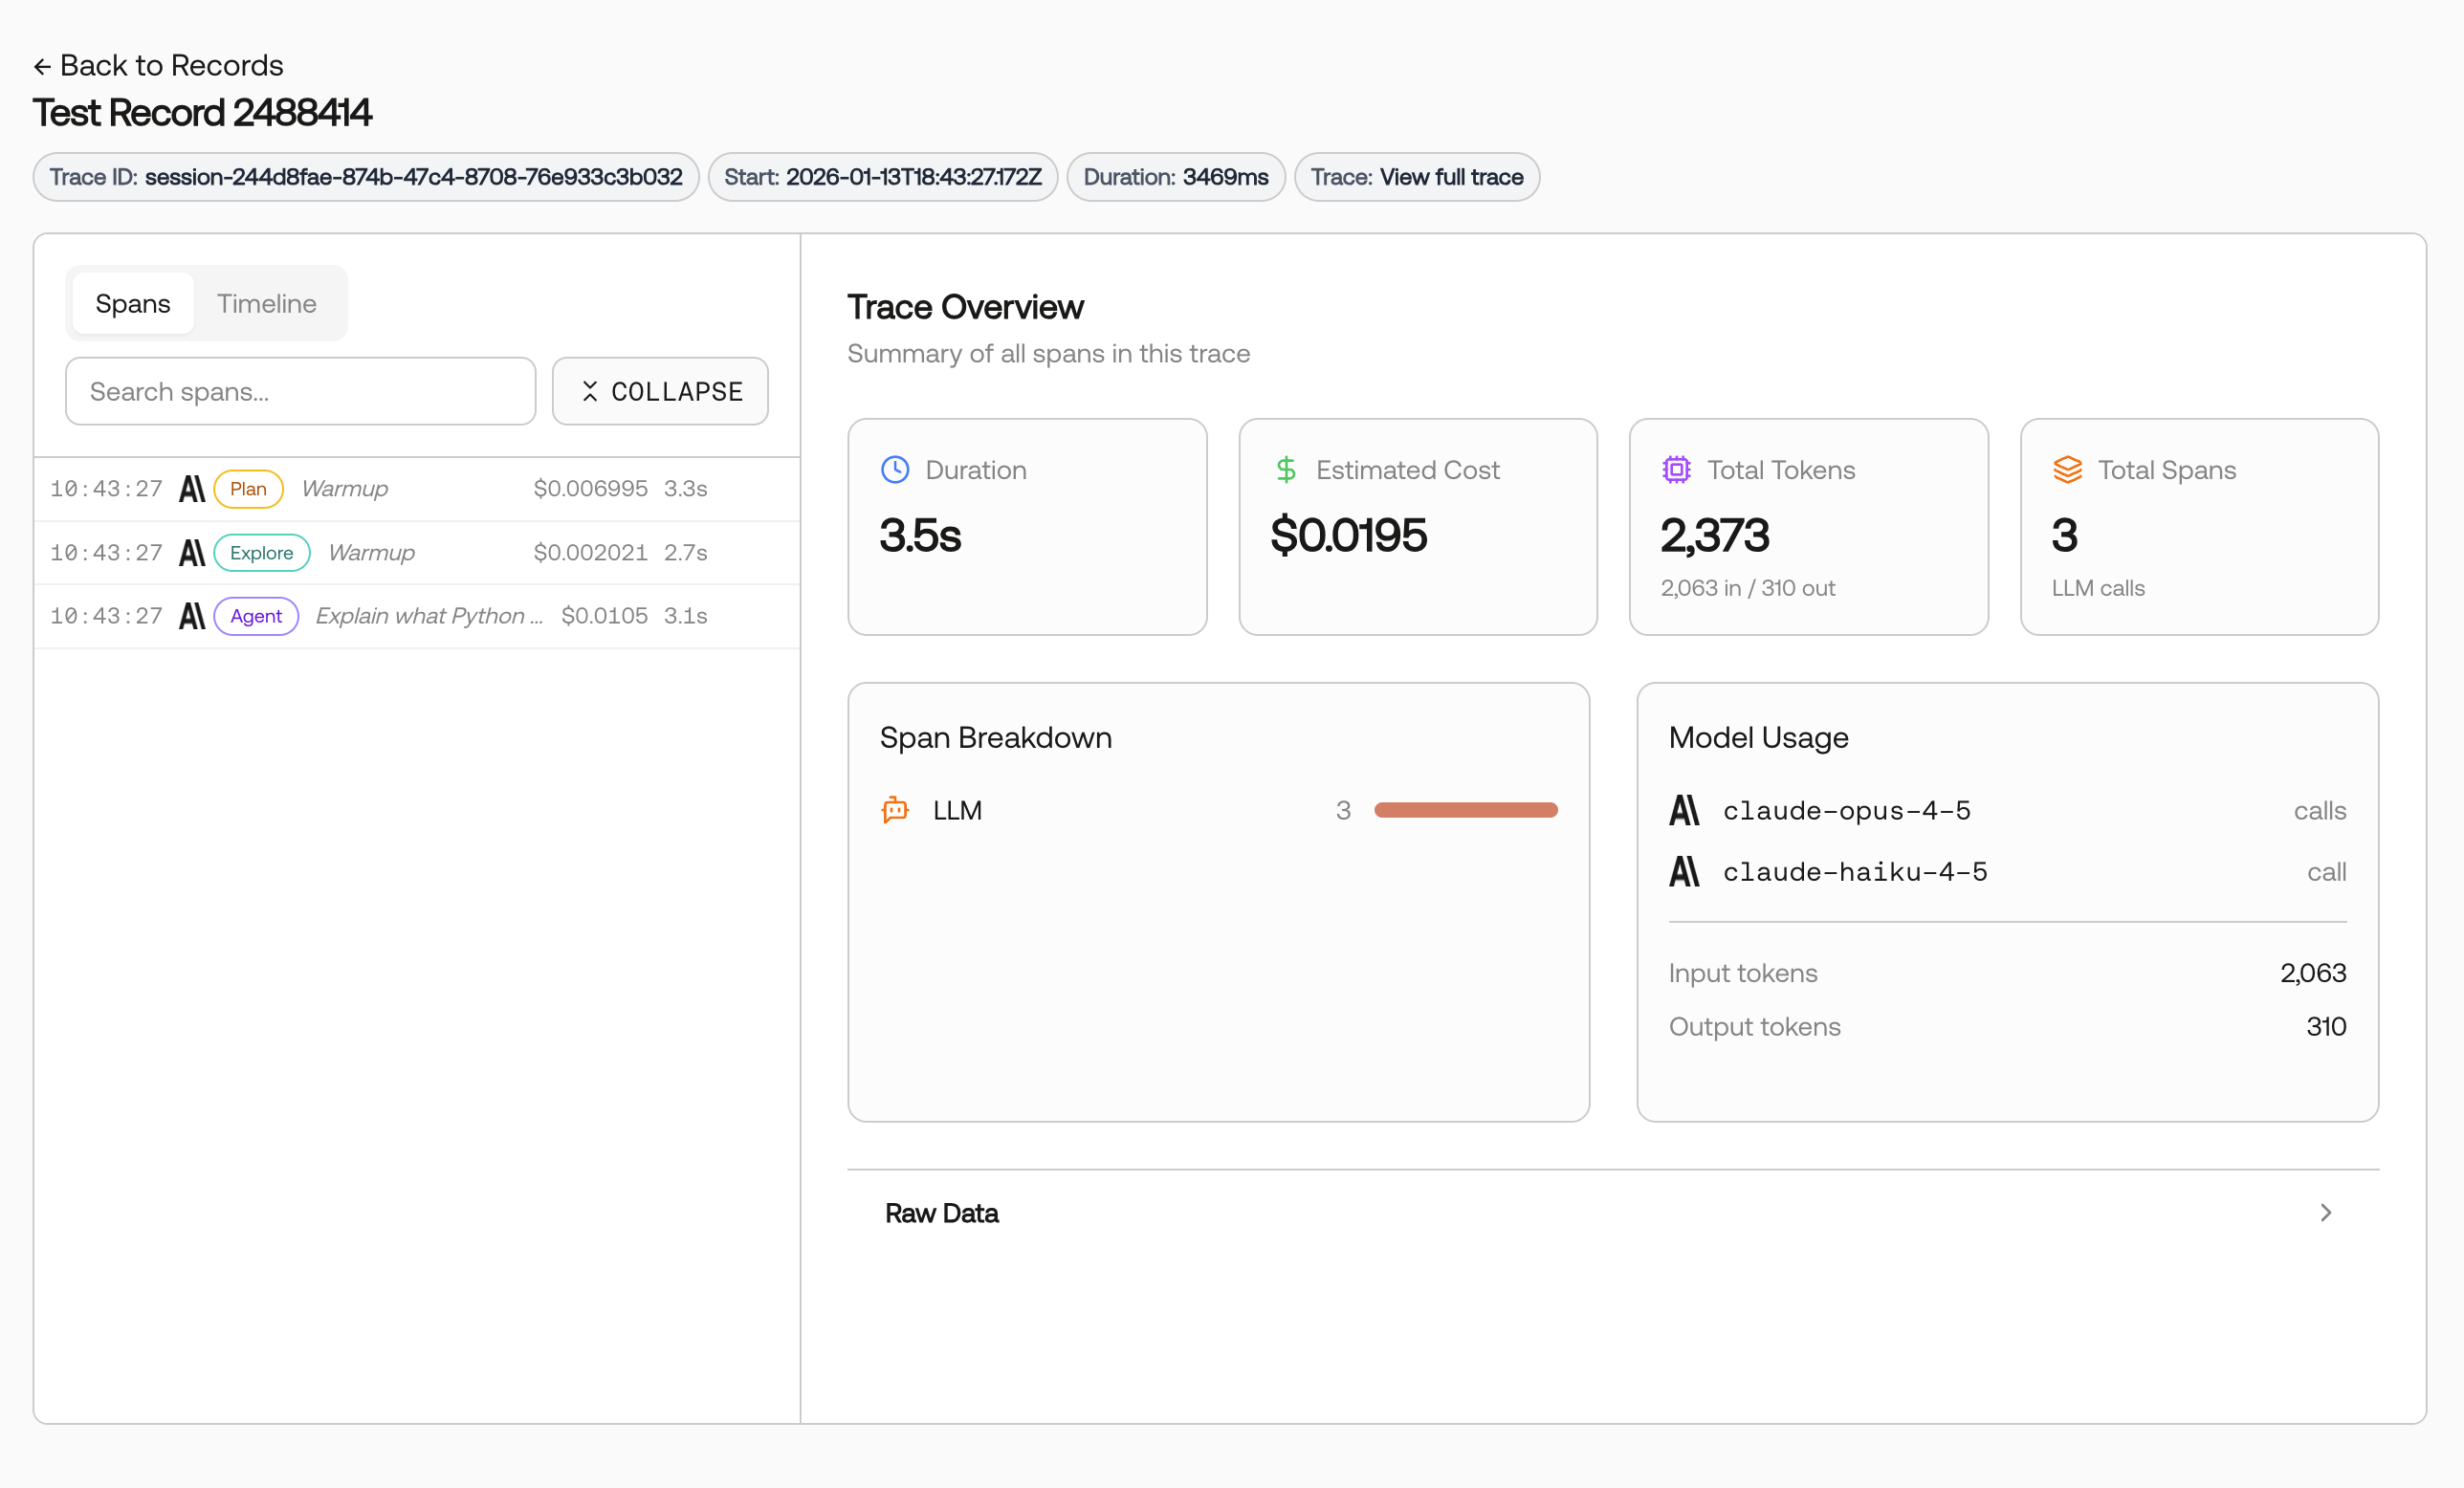
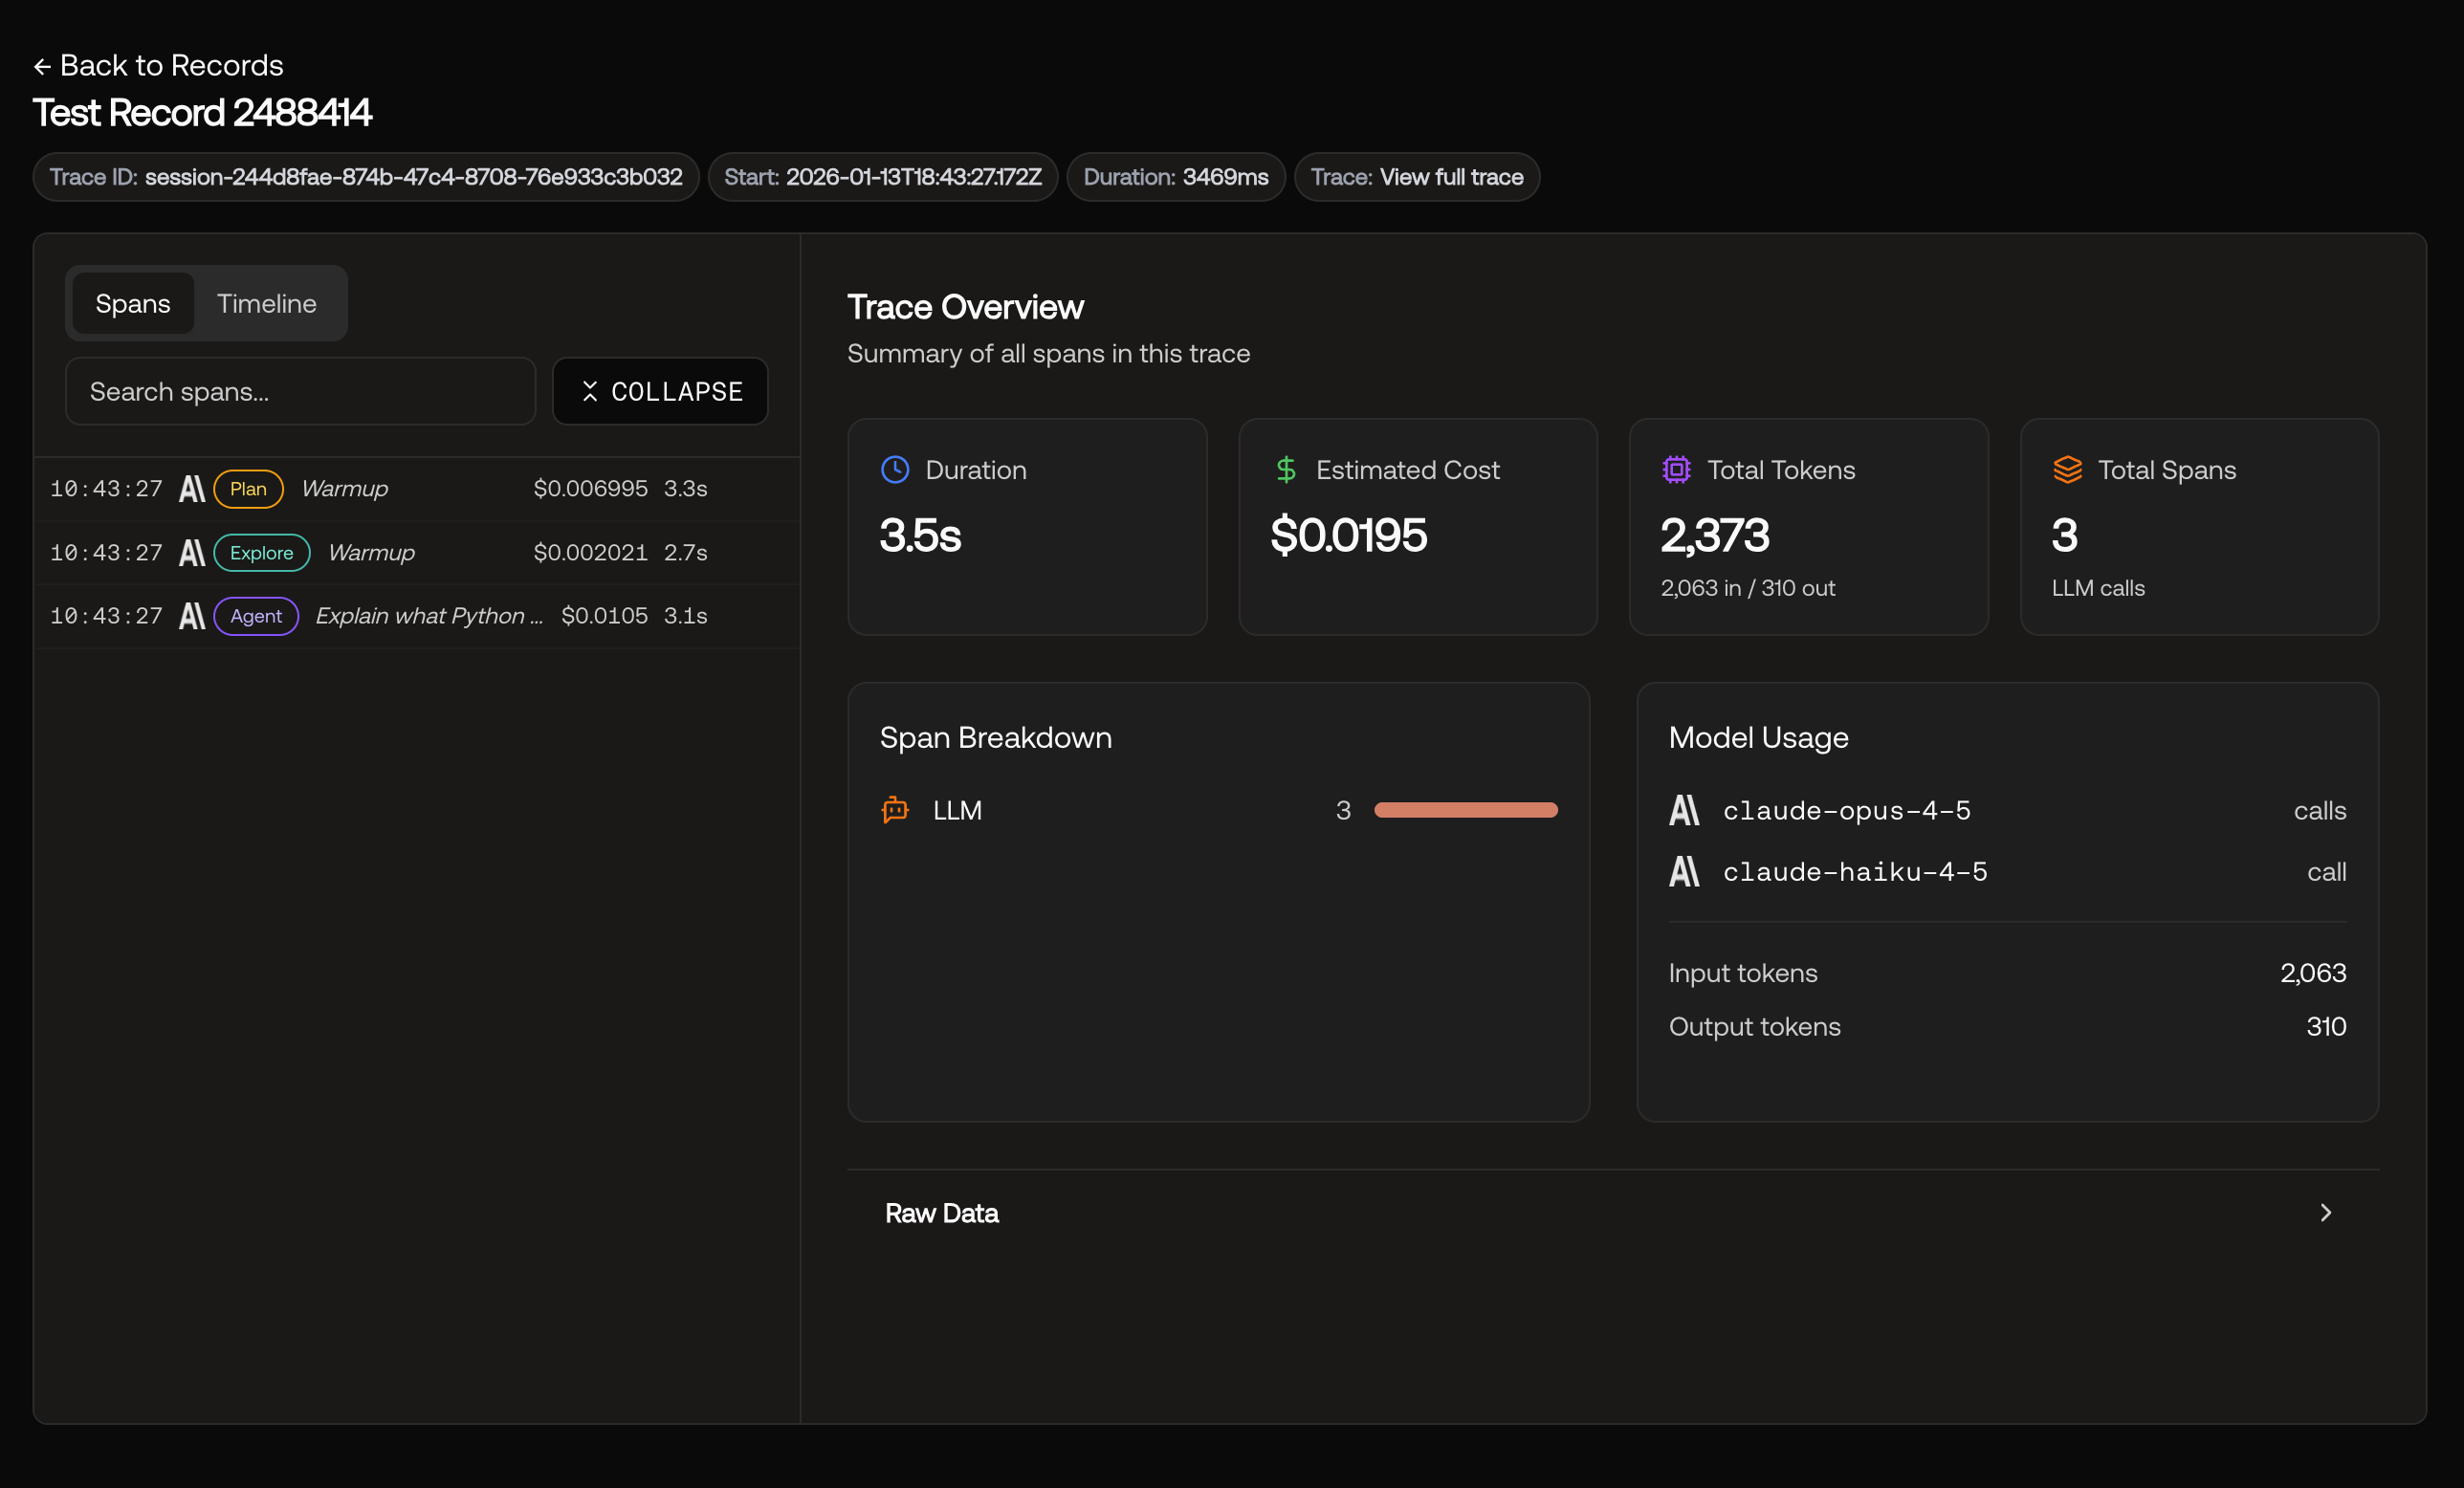
Click on any record to view the full trace details, including chain execution, LLM calls, and token usage.
Trace details with chain execution and LLM call data